Mesonet Station Design Considerations when selecting equipment for automated weather stations


Mesonet Essentials is a resource created in collaboration with members of the American Association of State Climatologists (AASC) and the national mesonet community. To learn more about the AASC vision, mission, goals, and membership opportunities, visit their website at www.stateclimate.org.
In this Section
- Introduction to Station Design
- The Need to Standardize the Stations of a Mesonet
- Standard Components of a Station
- General Considerations When Selecting Your Station Equipment
- Sensor Considerations
- Data Logger Considerations
- Communication Considerations
- Power Considerations
- Mounting Considerations
- Examples from Existing Mesonets
Introduction to Station Design
In addition to determining the overall design of your mesonet, you’ll also need to design the automated weather stations of your mesonet. The first step is to understand the different components of an automated weather station. Then, with your general list of needed components and the objectives of your mesonet project in hand, you can select the specific equipment you need to generate your mesonet products.
The Need to Standardize the Stations of a Mesonet
After it is operational, maintaining a full mesonet—consisting of anywhere from two dozen to 200 automated weather stations—can be a daunting task. To simplify operations, it is a good idea to standardize station equipment across the entire network. Equipment standardization allows your technicians to be more efficient for component servicing, calibration, troubleshooting, maintenance, and replacement. If every station has different components, it makes the process much more cumbersome. Moreover, using identical station components across a mesonet makes it easier for you to compare the data from various stations.
The New York State Mesonet offered this insight:
The key to operating a large network accurately and efficiently is "simplification, simplification, simplification," and standardization is key. If you can standardize all your sensors and software, then this will save untold hours later in problem-solving issues. This will also make your software easier, your metadata simpler, and generate far fewer questions from your users. Everyone will appreciate the simplicity!
Standard Components of a Station
Some standards for mesonets have been formally outlined:
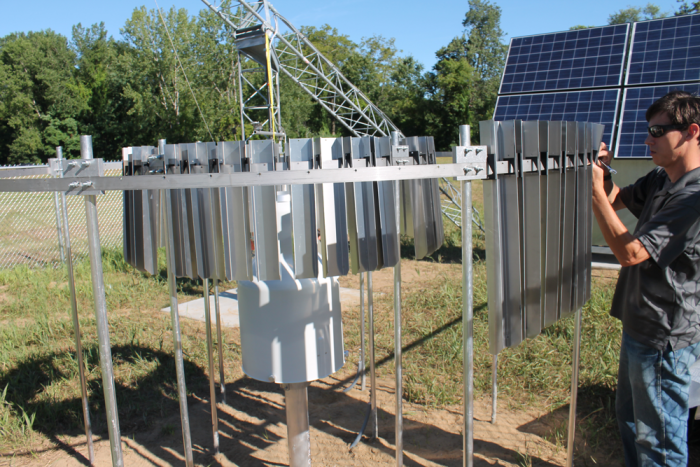
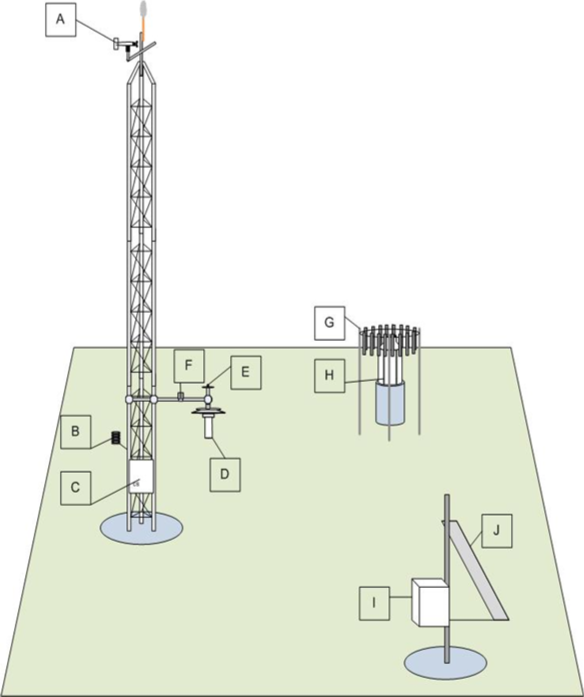
Most Mesonet stations consist of sensors wired directly into central data logging and micro processing units. Sensors, data logger, power, and communications sub-systems are mounted onto tripods or towers with small horizontal footprints of between 1 and 3 meters. With all sensors effectively co-located, sensor exposure is chosen based on several siting criteria and operational requirements.
Your station will typically consist of a weatherproof enclosure that contains the data logger, rechargeable battery, telemetry (optional), and the meteorological sensors. Sometimes the power sources (solar panel and battery) are mounted to the same structure as the other equipment. Other times, the power sources are mounted on a separate tripod, tower, or pole. (It is not recommended to mount power sources to buildings or rooftops.) Wherever the power sources are mounted, it is important to ensure that they don’t modify the measurement environment and influence sensor measurements, such as temperature, wind, and precipitation.
(Image courtesy of Dr. Rezaul Mahmood, Associate Director, KY-Mesonet)
The station may report in near real-time via most modern telecommunications systems, or the station may save the data for later recovery. In the past, automated weather stations were often placed where electricity and communication lines were available. Today, solar panels, wind turbines, and mobile phone technology have made it possible to have wireless stations that are not connected to the electrical grid or hardline telecommunications network.
Standards: AASC 1985, ASABE EP505, EPA 1987, WMO 1983, WMO 2008, and LeRoy 2010.
“AASC Instrumentation and Data Standards Committee Report,” The State Climatologist 9, no. 4 (October 1985): 12-14. http://www.stateclimate.org/sites/default/files/upload/pdf/state-climatologist/00000029.pdf.
Campbell Scientific, Inc., "Weather Station Siting and Installation Tools" application note (1997). https://s.campbellsci.com/documents/us/technical-papers/siting.pdf.
"Guide to Instruments and Methods of Observation (WMO-No. 8)." World Meteorological Organisation: Geneva, Switzerland (2021). https://community.wmo.int/en/activity-areas/imop/wmo-no_8.
Michel Leroy, “Siting Classification for Surface Observing Stations on Land” (presentation at JMA/WMO Workshop on Quality Management in Surface, Climate and Upper-air Observations in RA II [Asia], Tokyo, Japan, July 27-30, 2010). http://www.jma.go.jp/jma/en/Activities/qmws_2010/CountryReport/CS202_Leroy.pdf.
On-Site Meteorological Program Guidance for Regulatory Modeling Applications, EPA-450/4-87-013 (Environmental Protection Agency, 1987).
R. Mahmood, R. Boyles, K. Brinson, C. Fiebrich, S. Foster, K. Hubbard, D. Robinson, J. Andresen, and D. Leathers, “Mesonets: Mesoscale Weather and Climate Observations for the U.S.,” Bulletin of the American Meteorological Society. http://journals.ametsoc.org/doi/pdf/10.1175/BAMS-D-15-00258.1.
Steven E. Hollinger and Robert W. Scott, “Station Wind Characterization,” Automated Weather Stations for Applications in Agriculture and Water Resources Management: Current Use and Future Perspectives (proceedings of an international workshop, Lincoln, Nebraska, March 6-10, 2000): 63-75. http://www.wamis.org/agm/pubs/agm3/WMO-TD1074.pdf.
Fiebrich, Christopher A., Jennie R. Atkins, Kevin R. Brinson, Nathan L. Edwards, Stuart A. Foster, Rezaul Mahmood, Christopher A. Redmond, Megan Marie Schargorodski, Jeffrey A. Andresen, and Xiaomao Lin. "The American Association of State Climatologists' Recommendations and Best Practices for Mesonets." In 100th American Meteorological Society Annual Meeting. AMS, 2020.
General Considerations When Selecting Your Station Equipment
Frequently, novice users of environmental monitoring equipment may not initially realize that selecting automated weather station equipment is often a balancing act among several desired values such as reliability, flexibility, ease of use, and expense. Unfortunately, there is seldom a solution that is strong in all those values. Many low-cost, easy-to-use weather stations may be well-suited to a backyard hobbyist but lack the durability, reliability, and flexibility needed for a mesonet. At the other extreme, sometimes the most robust stations are also the most expensive. The key is to get the best data you can to serve your stakeholders while minimizing the cost and maintenance overhead. For example, data from the low-cost personal weather stations intended for homes, backyards, and schools may not meet the accuracy standards or exposure criteria that are required for numerical weather prediction, sensor response times for public safety, or accuracy for environmental research. A station that must meet stringent WMO standards, for example, would have to meet the following requirements (summarized in the table below):
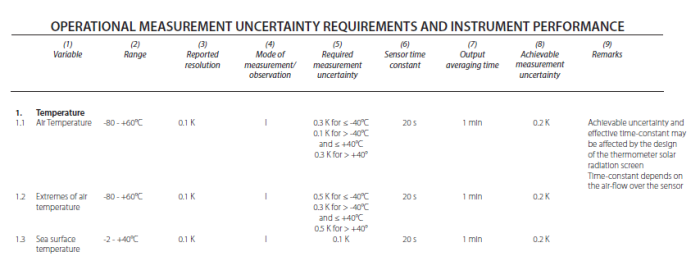
(Table information used with permission from the Guide to Meteorological Instruments and Methods of Observation)
Stations deployed in very remote, unattended locations (for example, Antarctic automated weather station networks) have demanding requirements related to power consumption and extreme temperatures:
As the year 2000 approached, several factors led to the realization that a new AWS system needed to be designed. One of the main factors was that critical components were no longer available because the design was 20 yr old. Advances in technology were also a factor because a newly designed station could have reduced power requirements, greatly reduced component size, more processing power, and the ability to add more and different sensors. The new unit had to be capable of transmitting data via an Argos-certified platform terminal transmitter or other communications methods such as radio modem or Iridium satellite phone. The choice was between building a newly designed station in house or using a commercial off-the-shelf (COTS) data logging system. Part of the difficulty in making this decision was that at this time commercial products were not built to the required specifications suitable for polar use and thus were not likely to function on the high Polar Plateau, where temperatures can become as cold as −80°C (the world record temperature is −89.2°C recorded at Vostok Station, Antarctica).
In the following sections, there is a discussion of the particular considerations related to selecting the various types of components for your automated weather stations.
“AASC Instrumentation and Data Standards Committee Report,” The State Climatologist 9, no. 4 (October 1985): 12-14. http://www.stateclimate.org/sites/default/files/upload/pdf/state-climatologist/00000029.pdf.
Bertrand D. Tanner, “Automated Weather Stations,” Remote Sensing Reviews 5, no. 1 (1990): 73-98.
Campbell Scientific, Inc., "Weather Station Siting and Installation Tools" application note (1997). https://s.campbellsci.com/documents/us/technical-papers/siting.pdf.
"Guide to Instruments and Methods of Observation (WMO-No. 8)." World Meteorological Organisation: Geneva, Switzerland (2021). https://community.wmo.int/en/activity-areas/imop/wmo-no_8.
Matthew A. Lazzara, George A. Weidner, Linda M. Keller, Jonathan E. Thom, and John J. Cassano, “Antarctic Automatic Weather Station Program: 30 Years of Polar Observation,” Bulletin of the American Meteorological Society 93, no. 10 (2012): 1519-1537. https://doi.org/10.1175/BAMS-D-11-00015.1.
Observing Weather and Climate from the Ground Up: A Nationwide Network of Networks, (Washington, DC: The National Academies Press, 2009). https://doi.org/10.17226/12540.
On-Site Meteorological Program Guidance for Regulatory Modeling Applications, EPA-450/4-87-013 (Environmental Protection Agency, 1987).
R. E. Yoder, T. W. Ley, and R. L. Elliott, “Measurement and reporting practices for automatic agricultural weather stations,” National irrigation symposium. Proceedings of the 4th Decennial Symposium (Phoenix, Arizona, November 14-16, 2000): 260-265.
“About The New York State Mesonet,” University at Albany, accessed June 20, 2017, http://www.nysmesonet.org/about.
Bruce Russell, “AZMET: The Arizona Meteorological Network: A Brief Overview,” accessed June 20, 2017, https://cals.arizona.edu/azmet/azmet04.htm.
“Delaware: Environmental Observing System,” Campbell Scientific, Inc., accessed June 20, 2017, https://www.campbellsci.com/delaware-environmental-observing-system.
“Instruments,” Board of Regents of the University of Oklahoma, accessed June 20, 2017, https://www.mesonet.org/index.php/site/about/instruments.
“Top 20 Extreme Weather Events in Mesonet History,” Board of Regents of the University of Oklahoma, accessed June 20, 2017, http://www.mesonet.org/20th/.
Sensor Considerations
Determining which environmental phenomena need to be measured will help you determine which types of sensors you need. Most mesonet stations record a standard set of meteorological variables, but the measurements any specific station in your network includes should reflect the needs of your stakeholders. For example, growers in a northern state may be concerned about radiation frost killing their crops and will need measurements to support operations to prevent that loss from occurring. In this case, highly accurate temperature sensors with aspirated shields may be needed to measure temperature inversions. It may also be desirable to add a radiation frost detection sensor.
Resources: For more information on detecting frost, read the “Minimize Losses from Frost Using Direct Measurements” blog article, and refer to Apogee Instruments’ Leaf and Bud Temperature Sensor web page.)
The following are some common parameters that many mesonet stations measure and for which you will need the appropriate sensors:
- Air temperature
- Barometric pressure
- Rainfall amount
- Relative humidity
- Soil moisture
- Soil temperature
- Solar radiation
- Wind direction
- Wind speed
Moreover, the objectives of your mesonet project may require you to measure specialized parameters for which you will need the appropriate sensors. Some examples of these parameters are the following:
- Leaf wetness
- Long-wave radiation
- Momentum flux
- Net radiation
- Sensible and latent heat fluxes
- Short-wave radiation (albedo)
- Snow depth
- Snow water equivalent
- Soil heat flux
- Surface radiation temperature
- Trace gases (for example, CO2)
- Vertical profile of temperature and moisture
- Vertical profile of winds
- Weather radars (for example, X-band)
Obviously, selecting your sensors will probably involve a compromise of measurement needs from stakeholders, sensor performance and durability, maintenance requirements, and budgetary constraints. For each type of measurement, there are numerous sensor options you could use for your stations. Oftentimes, the sensors that have the highest accuracy preferred by specific scientific measurement needs may require frequent maintenance and will often cost more. At the other extreme, low-cost sensor solutions are seldom durable, require frequent replacement, and usually don't provide measurements that are accurate enough for stakeholders.
Suggestions and standards
Some proposed mesonet sites may involve challenging environmental considerations, such as extreme cold, high humidity, high heat, high altitude, or marine conditions. It is imperative in these situations to choose equipment that will not only provide good measurements over the whole range of possible conditions, but also survive in the extreme environment.
Most commonly, "surface" measurements consist of temperature and relative humidity, wind, precipitation, and air pressure. World Meteorological Organization (WMO) standards prescribe wind measurements at a height of 10 m in open areas, and pressure, temperature, and humidity at about eye level (1.5 m). There are however three regions (urban areas, mountains, and coastal zones) for which nature and/or people have created structures of significance on such small spatial scales that special measurement and network strategies are needed. These structures can create very strong gradients in atmospheric (and chemical) variables across short distances that are of vital importance to life and property. Whereas measurements over homogeneous terrain are intrinsically representative of a broader area, data in small-scale three-dimensional environments are often representative of only a tiny volume.
Instruments deployed in these regions will have unique requirements to ensure a successful and continuous data set. The following are some examples:
- Wind instruments deployed in either high-elevation or high-latitude locations may require product versions that are heated. In the case of mechanical wind sensors, you may need cup or propeller anemometers with ceramic bearings that have a lubricant that can withstand colder temperatures and still operate within the manufacturer’s specifications for starting thresholds.
- Precipitation gages may consist of heated tipping buckets and/or heated weighing gages to capture precipitation year-round.
Note: Using heated instruments increases the power budget requirement of the station. Instruments that operate using dc power require a charging source (either ac or dc) and larger solar panels and battery combinations in the case of remote, unattended locations.
- Because of salt and/or sea spray, combination air temperature and relative humidity probes deployed in marine or coastal environments may require filters that are either easily replaced or cleaned. In addition, applications in these environments may benefit from sensors with a special coating that is resistant to corrosive agents and pollutants. Deployment in more extreme environments may require product specifications with extended operating temperature ranges.
- Solar radiation sensors deployed in any location that has a unique microclimate may require a heater that keeps water (liquid and frozen) off the sensor to minimize errors caused by dew, frost, rain, and snow blocking the radiation path. This helps ensure continuous measurement and data collection.
- Barometric pressure sensors mounted in higher elevations need to be designed to cover lower pressure ranges while still measuring synoptic events. In addition, these sensors may need to be fitted with a pressure plate or pressure port to accommodate pressure fluctuations from wind passing across the sensing port (pitot tube effect).
Wind, air temperature, and water vapor pressure measurements are affected by surface type and roughness, soil moisture, regional topography, and obstructions. Sites selected for their applicability to a broader area should be free from obstructions such as buildings, trees, and steep slopes. Ten-meter towers are often used to raise measurement heights above low-lying obstructions. The following table lists the suggested measurement heights and exposure (distance to an obstruction) for each type of sensor. Notable standards are in parentheses with references below.
Suggested Measurement Heights and Exposure
| Sensor Type | Measurement Height or Depth | Exposure Considerations |
| Wind |
|
No closer than ten times the obstruction's height |
| Air Temperature and Relative Humidity |
|
The sensor must be housed in a ventilated radiation shield to protect the sensor from thermal radiation. The EPA recommends the sensor be no closer than four times the obstruction's height and at least 30 m from large paved areas. |
| Solar Radiation | Height should be consistent with the exposure standard (AASC, WMO, EPA). To facilitate leveling/cleaning, Campbell Scientific recommends installing at a height of 3 m or less. | The sky should not be blocked by any surrounding object. However, objects < 10° above the horizontal plane of the sensor are allowed. |
| Precipitation |
|
AASC and EPA suggest the sensor be no closer than four times the obstruction's height. The orifice of the gage must be in a horizontal plane, open to the sky, and above the level of in-splashing and snow accumulation. |
| Soil Temperature |
|
Measurement site should be 1 m² and typical of the surface of interest. The ground surface should be level with respect to the immediate (10 m radius) area. |
More details regarding specific sensor types are discussed in the following sections.
Temperature
Temperature sensors use thermistors or thermocouples as sensing elements. These provide very accurate analog measurements that are often used in automated weather stations. Thermistors yield independent measurements of air or soil temperature. In contrast, thermocouples require an additional reference temperature reading—normally furnished by a thermistor.
To maintain the accuracy and representativeness of these instruments, they are installed in special radiation shields (shelters) that have natural ventilation. Occasionally, the shields (or shelters) are artificially aspirated (from a dc-powered fan) to reduce biases caused by heat loading from the sun.
Periodic recalibration and/or validation of the probe is ideal. Independent temperature sensors are often checked against primary standards at multiple temperature points in temperature-controlled chambers or ice baths, glycol baths, etc.
Relative humidity
Modern relative humidity (RH) sensors are typically referred to as capacitive humidity sensors. They are built with a dielectric polymer (a poor electrical conductor but an efficient supporter of electrostatic fields) that changes its dielectric constant with changes in surface moisture. This capacitive circuit outputs a voltage proportional to the amount of moisture in the air.
It is important to consider the recalibration needs for these sensors. The best recalibration will be under laboratory conditions, preferably using a dew point generator that can output multiple repeatable water vapor concentrations. Other options include replacing the humidity-sensing elements on a regular interval (such as annually) with replaceable humidity “chips.” When considering the options, keep in mind that handling these chips can affect the performance specifications of the sensor and introduce errors.
Resource: For more information about combination air temperature and relative humidity sensors, read the “Air Temperature and RH Sensors: What You Need to Know” blog article.
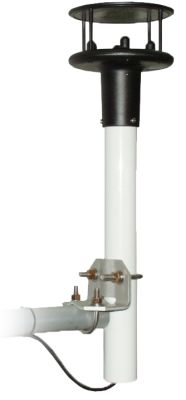
Solar radiation
Short-wave solar radiation is commonly measured with pyranometers. A pyranometer is a sensor that converts the global solar radiation it receives into an electrical signal that can be measured.
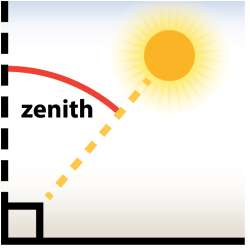
The intensity of solar radiation depends on the angle at which it reaches the earth. This is referred to as the zenith angle. The zenith angle is zero when the sun is directly overhead (vertical) of the earth. (This is when the solar radiation is most intense.) When the sun is lower in the sky, there is a larger angle between the vertical and the sun, so there is a greater zenith angle. (This is when the solar radiation is weak.) A good solar radiation sensor can account for weaker solar radiation to provide a more accurate representation of the solar radiation for a day.
There are two common types of pyranometers: thermopile and silicon photocell.
- For thermopile pyranometers, a thermopile is used within the instrument as the sensor, and the thermal gradients are measured across hot and cold areas (black and white). The radiation intensity is proportional to the temperature differences between the two sensing areas. Accuracy depends upon the sensitivity of the material used in the sensors, the response time, and the distortion characteristics of the material constituting the dome (if present) covering the sensors.
- For silicon photocell pyranometers, electric current is generated by a photo-sensitive diode in proportion to solar intensity. Ordinarily, silicon photocell pyranometers are not fully sensitive to the full spectrum of visible light, and they cannot “see” a certain portion of the electromagnetic spectrum such as under cloudy conditions or vegetative canopies. Silicon cell pyranometers will introduce errors under these conditions. In full sunlight conditions, however, they are calibrated to properly output solar radiation measurements.
Resource: For more information about pyranometers, read the “Pyranometers: What You Need to Know” blog article.
Wind direction and wind speed
Wind direction sensors can be measured directly from a mechanical wind vane.
A wind direction sensor contains a circular potentiometer (typically 1 to 10,000 ohm resistance) used to determine vane direction (in the polar coordinate system). This type of sensor requires an excitation voltage to measure the resistance. When the wind direction is measured using an ultrasonic anemometer (that has no moving parts), the wind direction is computationally derived from the raw X, Y, or Z (for a 3-D ultrasonic anemometer) vector components.
Computations for a statistically correct averaged wind direction or wind vector are fundamental to mesonet stations today. These computations are useful in a variety of applications including climatology, agriculture, and EPA monitoring for dispersion modeling.
Processing average wind direction data is not simply accomplished by the computation of normal averages because the raw data is presented in the polar coordinate system (that is, 0 to 360 degrees). For example, imagine that the wind is from the north, you have 10 samples, and half of them are 360 degrees, whereas the other half are 0 degrees. The result is 180 degrees. While this is a mathematically correct result, it is meteorologically incorrect.
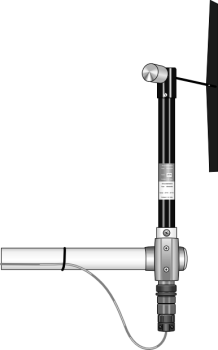
Horizontal wind speed is measured using anemometers, which are typically placed at a height not less than 2 m above the ground, and often at 10 m, following recommendations by WMO. The following are the most common anemometer types:
- Mechanical three-cup anemometers that rotate about a vertical axis
- Mechanical vane-mounted propellers that rotate about a horizontal axis
- Ultrasonic anemometers that have no moving parts
Cup and propeller anemometers
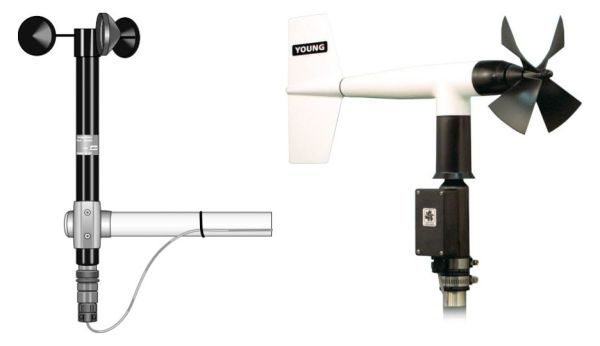
A cup anemometer responds to air flow past the cups in any horizontal direction, turning a vertical shaft at a rate that is proportional to the wind speed. Cup anemometers are designed to respond to the total wind, thereby overestimating the horizontal wind speed by a small percentage when a strong vertical flow exists. In contrast, a propeller anemometer follows a cosine response, measuring the component of wind parallel to the axis of rotation.
Measurements from both cup and propeller anemometers are reliable if routine maintenance is conducted to ensure appropriate functioning of the mechanical parts. In addition, these anemometers have the durability to withstand continuous use and provide a level of accuracy that is sufficient for most purposes.
The choice of the measurement system will depend on the output signal of the anemometer. For example, anemometers available in the market today are often equipped with generators that produce a voltage signal that is proportional to the wind speed. Some anemometers may be equipped with small magnetic reed switches or opto-electronic couplers that generate electric impulses in proportion to the wind speed.
Resource: For more information about wind speed measurements, read the "Why Do Variable Wind Speed Readings Occur with a Constant Wind?" blog article.
Ultrasonic anemometers
Ultrasonic anemometers use acoustic signals for measurement of wind speed. This method of wind measurement requires no moving parts, and maintenance is minimal. Obstructions in the measurement path can influence the measurement output. Typically, this type of sensor has no user-serviceable parts and can only be serviced by someone specially trained to do so. Consequently, the repair service or recalibration of an ultrasonic anemometer must be done by the manufacturer.
Rainfall amount
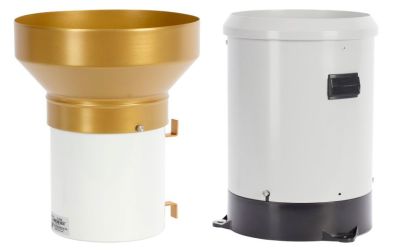
Rain gages provide a point measurement of rainfall amount, but there is a need to also know rainfall distribution. Rain gages in mesonets provide rainfall measurements with a high degree of accuracy at specific locations, but in most cases, the instruments are too sparsely distributed to accurately capture the high geographical and time-based variability of precipitation events. Weather radars and satellites can be used for this purpose, but they do not measure rainfall directly. Instead, rainfall is estimated in algorithms from their measured quantities. Because it is an estimate, it requires validation or a check for accuracy. Rain gage measurements can be used to validate weather radar and satellite rainfall estimates.
Tanner offers an account of sensors for measuring precipitation:
Liquid precipitation is measured using tipping bucket and weighing rain gauges. The tipping bucket gauges are popular because of the lower costs and simplicity. A septum divides the pivoting bucket into two volumes, one of which is always beneath the funnel draining the collection area. When the amount of water determining the resolution of the gauge is collected, the bucket tips and empties, positioning the other volume beneath the orifice. The tipping motion provides an electrical contact closure by sweeping a magnet past a reed switch. WMO recommends a minimum resolution of 0.2 mm per tip for research studies but volumes of 0.1, 1 and 0.25 mm (0.01 in) are also common. Nearly all gauges have stops which are adjusted to set the volume per tip. Where accuracy is important the manufacturer’s calibration should not be assumed. Errors of 10% or greater are not uncommon, being worse for high resolution gauges.
A characteristic of tipping bucket gauges is the error in total precipitation which increases with rainfall intensity. This is caused in part by the total amount of precipitation collect yet not accounted for during the time interval required for each tip. The sensitivity of this error to rainfall intensity decreases for gauges having larger bucket volumes (lower resolution or larger orifice gauges).
Weighing gauges contain buckets which accumulate the total precipitation (liquid and winter precipitation) until they are emptied. The buckets rest on spring loaded platforms and their position is sensed by linear potentiometers, LVDT’s etc. Weighing gauges are two to three times more expensive than tipping bucket gauges but their accuracy is not intensity dependent and their resolution is limited on by the mechanical sensitivity of the platform mechanism. They are used to record winter time precipitation by charging the bucket with anti-freeze to melt solid forms of catch. Whether weighing gauges or propane heating tipping bucket gauges are used, accurate measurement of snowfall is not possible under windy conditions because of the poor catch. Snowfall can be underestimated by up to 40% in 10 m/s winds because the particles are carried over the gauged orifice, regardless of shielding efforts.
Barometric pressure
Barometric pressure sensors typically measure the range of 500 to 1100 mb. This range equates to less than sea level (as in an underground mining operation) to more than 15,000 feet above sea level. Current barometers feature variable capacitance-sensing elements. They can output data in analog (voltage or current) or digital data format, as described in their manufacturers’ instruction manuals.
Barometers have no moving parts, and maintenance is minimal. Barometric pressure sensors have no user-serviceable parts. Because these sensors require specialized training for servicing, they need to be sent to calibration facilities.
Soil moisture and temperature
Modern methods for making soil moisture measurements are appropriately termed soil volumetric water content and soil water matric potential.
- Soil volumetric water content probes provide data regarding how much water is in the soil.
- Water matric potential probes are soil probes that, for example, provide data about the movement of water from the soil into the roots of a plant.
Soil moisture sensors are typically intended for long-term deployments with few maintenance requirements.
Soil temperature sensors come in a variety of designs using thermistors, thermocouples, thermocouple wires, and averaging thermocouples. The electrical signals transmitted from the sensors to a sensitive data logger that can resolve mV to µV signals can be converted to different units of measurement, including °C , °F, and °K.
Resource: For more information about soil water content sensors, read the "How to Find the Best Soil Water Content Sensor for Your Application" blog article.
“Air Temperature Sensors,” Kentucky Mesonet, accessed June 20, 2017, http://www.kymesonet.org/instrument.html#!instrument.
Data Logger Considerations
The data logger serves as the brain of an automated weather station and is used to scan the sensors repeatedly. It receives the electrical signals from the sensors, performs any programmed calculations, converts the data as necessary to other units of measurement, and stores the resultant data in the data logger memory. The data logger also controls processes such as alarms and power, and serves as a gateway for data transmission back to a central location. A high-quality data logger is essentially a rugged, low-power field computer that can survive at a station site for years with little maintenance required.
The signal output from each sensor must be compatible with the data logger input terminal to which it is connected. Select a data logger that has terminals of the correct type and quantity to accommodate all the sensors at a station. Most sensors have either an analog (current or voltage) or digital (SDI-12, serial, Modbus) output. Your data logger needs to have the capability to process the types of electrical signals from the sensors you choose. If this is not possible, consider using a compatible multiplexer with the data logger for additional terminal capacity.
Frequency of measurements
Both the recording and measurement interval affect the usefulness of the recorded data—the former determining the temporal resolution, and the latter determining the degree to which the measurement represents the variable. Variables that change rapidly over the recording interval require more frequent measurements than do slowly changing variables. The table below lists recorded values for standard automated weather station variables that are useful for characterizing local conditions:
| Variable | Units | Measurement Interval(s) | Hourly Values | Daily Values |
|
Solar radiation |
W/m2 |
10 |
Average |
Total
|
|
Air temperature |
deg C |
60 |
Average |
Maximum, minimum |
|
Relative humidity |
% |
60 |
Sample |
Maximum, minimum |
|
Vapor pressure |
kPa |
60 |
Sample |
Maximum, minimum |
|
Wind speed |
m/s |
1 to 10 |
Average, maximum, minimum, standard deviation |
Maximum |
|
Wind direction |
degrees |
1 to 10 |
Average, standard deviation |
Wind vector |
|
Precipitation amount |
mm |
|
Total |
Total |
|
Precipitation intensity |
mm/hr |
|
|
|
|
Soil temperature |
deg C |
60 |
Average |
Maximum, minimum |
Processing measurements
The automated weather stations that are available today offer some form of numerical processing of the measured value prior to storing the data. This capability ranges from providing a few selectable functions to complete instruction sets. The ability to record processed values instead of individual measurements greatly reduces the data storage requirements without compromising measurement rates.
Measured variables alone may not adequately represent the data you seek, and numerical processing may be necessary to record averages of derived quantities. For example, vapor pressure is a more useful variable in many cases than the more commonly measured relative humidity (RH). The average RH and temperature should not be used to compute average vapor pressure; instead, vapor pressure should be computed each time RH and temperature are measured, and then the average vapor pressure should be recorded.
Conditional recording (or not recording) is based on other measurements, events, or time. Rainfall intensity, for example, can be obtained by recording time whenever a prescribed amount of rain has accumulated. Another example is the discarding of wind direction values whenever the anemometer indicates zero wind speed.
Additional features and technology
Additional features include the ability to view measurements in the field on mobile devices or a keyboard scaled to physical units, numerical linearization of non-linear sensor signals (such as thermistors), and conditional recording.
Current technology for high-quality data loggers combines low-power electronics with fast microprocessors, low noise 24-bit A/D conversion, transient protection, and large onsite storage capabilities using secure digital (SD) cards. As Internet Protocol (IP) communications have become more commonplace, some data loggers offer rich telecommunication options through cellular, satellite, physical Ethernet, and Wi-Fi connections.
Given the diverse nature of environmental monitoring, data loggers should be tested in an environmental chamber over ranges of -40° to +70°C. To ensure successful, continuous year-round data logging at your station site, consider data loggers with extended temperature ranges between -55° to +85°C.
Resources: For more information about data loggers, refer to the "Fundamentals of Data Loggers and Data Acquisition Systems" and "Purchase Considerations for Data Loggers and Data Acquisition Systems" topics.
Communication Considerations
The convenience and reliability with which measurements are retrieved from the field and transmitted to a central computer are important considerations. Data may be stored onsite and retrieved manually or retrieved remotely using various telecommunication options. The most common method used to remotely access field data is through Internet Protocol (IP) connections.
While each mesonet will have its own desired method of communication—such as Ethernet, phone lines, 900 MHz radios, Wi-Fi, satellite, police or emergency bands, etc.—the current predominant communication method is cellular modem transmission over a standard provider network (such as Verizon). The communication option you use will typically be the most power-consuming component of your automated weather station, so you'll need to budget your power to allow for frequent transmissions.
For station site locations that have difficulty accessing a cellular network, mesonet operators may need to employ multiple communication methods to retrieve the station data remotely.
The following are some additional tips for consideration:
- Review the communication capabilities of the data logger to determine if the data logger has integrated capabilities or can integrate with an external communication peripheral.
- Determine the accessibility of the site, how the acquired data needs to be accessed, from where the data needs to be accessed, how frequently the data needs to be accessed (such as at five-minute or 15-minute intervals), and the amount of data to be transmitted (such as kilobytes or megabytes per day).
- Each telecommunication option has its own requirements that should be reviewed prior to finalizing a decision. For example, review the transmission distance or area of each option. Also, review the applicable service requirements and fees for each option (such as the data plan cost per MB).
- Occasionally, cell phone towers are down for maintenance.
- Radio transmissions may be less reliable during weather events.
- The satellite options tend to be the most expensive but may provide the most reliable service in remote areas.
- If you are considering using a telecommunication option that involves cellular phones, radio frequency (RF) networks, or satellite systems, research the availability of these services at your site location. Communication via telephone or the Internet requires the appropriate service to be available within a few miles of the site. You may find that a particular option is not available or does not provide the coverage you need.
- If you would like to use an RF network and there are line-of-sight obstructions, such as mountains, consider using a repeater station to enable the base station to receive data from the field station(s).
- If you would like to use an RF network, investigate whether an FCC license is required. In addition, it’s a good idea to design RF networks in the summer during full foliage; otherwise, you may experience transmission problems every spring as trees begin to leaf out.
Power Considerations
When you are considering your power needs for your automated weather station, be sure to address the following topics:
- How will you power your station?
- What are the power requirements for each component of the station?
- How long does the station need to run continuously in the event of power problems before you can get someone onsite to fix them?
Power availability is an important consideration in selecting station equipment. If your station uses battery and solar power, the sensors, data logger, and communication devices need to use the least amount of power possible to keep the station online continuously—especially in the event of power problems such as a broken solar panel or long durations with cloudy skies. Some sensors, such as gas analyzers, require much more power than typical meteorological weather station sensors, so planning for their use is critical.
For a data logger to continue its cycle of receiving electrical signals from sensors, storing the data, and transmitting the data, it is necessary for the weather station to have a reliable power supply. When a station is installed at a site without access to ac power, either a rechargeable battery or alkaline batteries are typically used. Alkaline batteries require replacing, and a rechargeable battery requires recharging. Recharging a battery necessitates the use of a regulator and a charging source. The charging source is typically either an ac transformer or a solar panel.
Power to an automated weather station can be supplemented with an external rechargeable battery, which is also recharged using a regulator and a charging source.
The number and size of the batteries needed depends upon the current drain of the station, the maintenance interval, and the amount of solar power available.
The following are some additional tips for consideration:
- Stations in colder environments typically require more heated sensors, which require more power.
- The more sensors you use at a station, the greater the power requirement.
- Consider your site location and if the amount of available solar radiation makes using a solar panel a viable option. If your station is located at a site that receives minimal sunlight, ensure that you will have enough power supply for continuous sampling. The solar panel must be able to supply enough wattage to recharge the battery, as well as maintain system power—even during periods of low solar radiation.
- While a solar-powered station is not affected by power outages, it does require battery storage.
- Determine the best position for a solar panel to receive maximum sun exposure.
- When researching utility power options, consider how you will access the power and what the operation cost is.
- Create a power budget to determine your power needs. If you will be using solar power, determine how large of a panel and battery are needed.
Resources: For assistance determining the power needs of the components of your station, you can download and use The Power Budget Spreadsheet. For help using this tool, read the “How Much Power Does Your Data Acquisition System Need?” blog article and watch the “Power Budgeting” video.
In addition, there is a downloadable example of a completed power budget spreadsheet that represents the power considerations for the MesoPRO™ Research-Grade Mesonet Station.
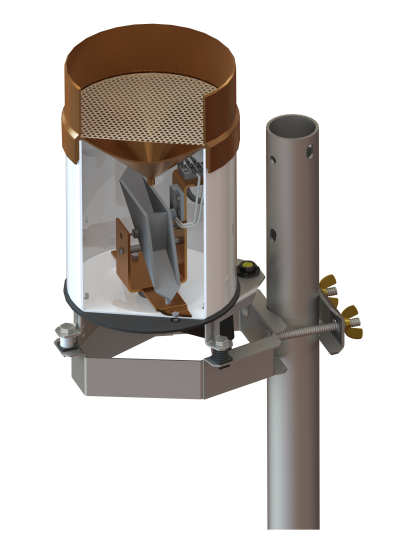
Mounting Considerations
Some of the electronics of your station—such as the data logger, power supplies, and some of the sensors—need to be housed in a sealed environmental enclosure. The components of an automated weather station, whether mounted in an enclosure or directly exposed to the elements, are grouped together and physically supported by mounting them to a structure, such as a tripod or tower. Stably securing the components to the structure, as well as securing the mounting structure itself, helps ensure the continued optimal performance of the station. To secure the mounting structure, you may need to use, for example, a poured concrete pad, a mounting plate, and/or guy wires.

Moreover, you will need to consider how to attach everything to your mounting structure. For example, you may need poles, crossarms, brackets, mounting plates, and/or shields to complete your mounting structure.
The following are some additional tips for consideration:
- A weather station installed in an alpine location may be adversely affected by snow accumulation and snow creep. For example, if a significant amount of snow covers the station components or slides down next to them, the snow’s pressure and weight may cause the mounting structure to crumple.
- Preparing a non-temporary site includes digging holes, setting the tower and pedestal foundations, and pouring the concrete for the pad.
- Consider what tower height is needed to mount sensors at the necessary height to achieve the most representative data.
- Ensure the tower can withstand the wind at the site. Review the wind load recommendation for the tower for both sustained wind and gust tolerance.
- If possible, position the instruments on the tower so that they are easy to reach for future maintenance and repair.
- When mounting sensors on the tower, ensure that the shadow from the tower does not affect radiation and temperature measurements and that the wind monitor is not obstructed.
Resources: For more information, see the MesoPRO Research-Grade Mesonet Station page and the Enclosures, Tripods, and Towers web page.
Examples from Existing Mesonets
The sampling rate for processing and storing measurements helps determine the size of the battery and solar panels needed for cloudy or extreme temperature conditions. Sampling rates can also be used to determine data transmission rates to a central location. With more frequent data transmissions, more power is required, and a larger battery and larger solar panels are needed. The electronics may be designed specific to the sensors and functions offered by the system. Alternatively, the mesonet station may use a stand-alone environmental data logger to perform the measurement, communications, and data storage functions.
There is dependency in the station design based off which state network is discussed and the individual stakeholder/data user needs. A few examples are outlined below.
Delaware
With measurements that refresh every five minutes, the Delaware Environmental Observing System (DEOS) provides up-to-date information on developing weather events. The data is used to assist with developing emergency management situations such as toxic spills, hazardous chemical releases, and flash flooding events. DEOS data is used for pesticide management, mosquito control, scheduled controlled burns, and refuse disposal activities.
Oklahoma
Mesonet data can help operators monitor extreme weather conditions and aid stakeholders in making critical decisions that affect human life and well-being. For example, some extreme weather conditions that the Oklahoma Mesonet has monitored are the following:
- Coldest high temperature
- Greatest one-hour rainfall
- Greatest one-hour temperature change
- Greatest seven-day temperature change
- Highest annual rainfall
- Highest heat index
- Highest one-day rainfall
- Highest temperature
- Highest wind gust
- Hottest summer in Oklahoma
- Longest stretch of consecutive hours below freezing
- Lowest annual rainfall
- Lowest temperature
- Lowest wind chill
- Most consecutive days with high temperatures above 100°F
- Most non-consecutive days with high temperatures above 100°F
- Warmest low temperature
- Windiest day across Oklahoma
How often are data measured?
All above-ground measurements are sampled every 3 seconds with the exception of the barometer (which is 12 seconds) and the rain gauge (which is event driven). The above ground measurements are averaged over 5 minutes. Soil temperature measurements are sampled every 30 seconds and averaged into 15-minute observations. Soil moisture is sampled once every 30 minutes. Every 5 minutes, all available observations are sent from the site to the Central Operations Facility in Norman.
Minnesota
Weather stations in Hennepin County, Minnesota are used and will be used for several purposes. According to Emergency Management Director Eric Waage, the Minnesota Vikings football team uses the data from one of the stations to determine when it’s too dangerous to practice outside. In addition to life safety issues, Waage mentions other uses:
We think farmers will like this, people who own ranches. Orchards, golf courses, people that do heating and cooling for buildings.
West Texas Mesonet
The West Texas Mesonet originated in 1999 as a project of Texas Tech University. The mesonet consists of 40 automated surface meteorological stations, two atmospheric profilers, and one upper-air sounding system. Each surface station measures up to 15 meteorological and 10 agricultural parameters over an observation period of 5 and 15 min, respectively. The mesonet uses a combination of radio, cell phone, landline phone, and serial server (Internet) communication systems to relay data back to the base station at Reese Technology Center (formerly Reese Air Force Base), Texas. Data are transmitted through the radio network every 5 min for most meteorological data and every 15 min for agricultural data. For stations located outside of the radio network, phone systems transmit data every 30–60 min. The archive includes data received through the various communication systems, as well as data downloaded in the field from each station during regularly scheduled maintenance visits. Quality assurance/control (QA/QC) tests effectively flag data for manual review from a decision maker. The QA/QC flags and review decisions are then added to the database. All data are available free of charge; real-time data are available on the West Texas Mesonet Web page, and an interface to access the data archive is currently being developed.
Each datalogger records a 5-min observation from each of the meteorological sensors and a 15-min observation from each of the agricultural sensors. Sampling intervals vary from 3 to 60 s depending on the sensor. Data are stored in the logger in the 5- and 15-min observation format. Up to 78 days of data can be stored in the circular memory buffer of each logger before data are lost. Each datalogger has two 6-V backup batteries in case power is lost from the main deep-cycle marine batteries. This battery system is separate from the main batteries and can power the datalogger for approximately one month. These batteries help prevent the loss of data acquisition at each site.
New York
What makes the New York Mesonet unique?
Like most mesonets, the New York State Mesonet's Standard sites collect measurements of a number of surface and atmospheric variables, such as air temperature, relative humidity, wind speed and direction, surface pressure, soil temperature, soil moisture, solar radiation, snow depth, and precipitation amounts for rainfall and snow accumulation.
What makes the New York State Mesonet unique is that in addition to its 126 Standard stations, the Mesonet also operates a network of 17 "Profiler" sites. Each Profiler site is equipped with state-of-the-art vertical profiling instrumentation that capture vertical profiles of temperature, relative humidity, and "3D" wind speed as well as an accurate measurement of boundary layer height and cloud base height. In addition, data from profiler instrumentation allow aerosol and cloud optical properties to be derived. The NYS Mesonet also operates two additional networks, including a network of 17 "Surface Energy Budget (SEB)" sites, that monitors radiative, heat, moisture, CO2, and ground flux, and a network of 20 Snow sites, that measures the Snow Water Equivalent (amount of water within the snow pack). All data are collected in real-time.
These surface and above-ground observations provide a very detailed, three dimensional "image" of the atmosphere at very high spatial and temporal resolutions. These high-resolution data and products are provided to the National Weather Service Weather Forecast Office (NWS-WFO) and the New York State Division of Homeland Security & Emergency Services (DHSES) to augment and improve their forecasting and emergency management decisions.
How often are data measured?
For Standard surface measurements, the data are collected every 1 to 5 minutes, with 5 minutes the standard data rate for most sensors. Profiler data are averaged over 5-minute periods. SEB data are averaged over 5-minute periods for radiation and soil flux, and 30-minute periods for heat, moisture, and CO2 flux. All observations are packaged, and transmitted, via the Internet, to a central Mesonet ingest system located in the University at Albany's state-of-the-art, Tier-3 certified Data Center. The data are quality assured, archived, and disseminated in real-time to generate a wealth of products available to user consumption through the New York State Mesonet web portal.
“About The New York State Mesonet,” University at Albany, accessed June 20, 2017, http://www.nysmesonet.org/about.
“Air Temperature Sensors,” Kentucky Mesonet, accessed June 20, 2017, http://www.kymesonet.org/instrument.html#!instrument.
Bruce Russell, “AZMET: The Arizona Meteorological Network: A Brief Overview,” accessed June 20, 2017, https://cals.arizona.edu/azmet/azmet04.htm.
“Delaware: Environmental Observing System,” Campbell Scientific, Inc., accessed June 20, 2017, https://www.campbellsci.com/delaware-environmental-observing-system.
“About Us,” Delaware Environmental Observing System, accessed May 7, 2018, http://www.deos.udel.edu/about/.
“Instruments,” Board of Regents of the University of Oklahoma, accessed June 20, 2017, https://www.mesonet.org/index.php/site/about/instruments.
“Top 20 Extreme Weather Events in Mesonet History,” Board of Regents of the University of Oklahoma, accessed June 20, 2017, http://www.mesonet.org/20th/.
“About the Oklahoma Mesonet,” Board of Regents of the University of Oklahoma, accessed June 19, 2017, http://www.mesonet.org/index.php/site/about.
J. L. Schroeder, W. S. Burgett, K. B. Haynie, I. Sonmez, G. D. Skwira, A. L. Doggett, and J. W. Lipe, “The West Texas Mesonet: A Technical Overview,” Journal of Atmospheric and Oceanic Technology 22, no. 2 (2005): 211-222. http://journals.ametsoc.org/doi/pdf/10.1175/JTECH-1690.1.