Mesonet Products Data and other mesonet deliverables for stakeholders


Mesonet Essentials is a resource created in collaboration with members of the American Association of State Climatologists (AASC) and the national mesonet community. To learn more about the AASC vision, mission, goals, and membership opportunities, visit their website at www.stateclimate.org.
The Importance of Determining the Mesonet Objectives Early
You might consider your mesonet to be the mechanism by which you can meet the identified long-term needs for deliverables (such as data products) for applications such as agriculture, hydrology, meteorology, and public safety.
Setting the objectives that you intend for your mesonet to accomplish is a critical first step that will help guide you in making the other decisions necessary for the planning and operation of your mesonet (station siting, communication, individual station configurations, sensors, measurement parameters, data processing, etc.). While it may be interesting to satisfy one’s curiosity regarding particular measurement parameters, unless those measurements help provide a deliverable that matches well with the project objectives and budget constraints, they do not serve a useful purpose.
Planning a mesonet is a task that can feel like a heavy burden, but this burden can be shared among the members of a steering committee, or some similar organizational structure, consisting of local and regional stakeholders. It is imperative for all the committee members to share a clear understanding of the mesonet objectives. Each member should be able to state why you are building the mesonet, which will help you have more productive planning meetings. These planning meetings are foundational to the concept and initial proposal for building a mesonet and the deliverables that the mesonet will eventually produce.
F. V. Brock, K. C. Crawford, R. L. Elliott, G. W. Cuperus, S. J. Stadler, H. L. Johnson, and M. D. Eilts, “The Oklahoma Mesonet: A Technical Overview,” Journal of Atmospheric and Oceanic Technology 12 (1995): 5-19. http://journals.ametsoc.org/doi/pdf/10.1175/1520-0426(1995)012%3C0005%3ATOMATO%3E2.0.CO%3B2.
M. J. Melvin, A. I. Zygielbaum, D. Gutzmer, S. Rentschler, J. Bower, and K. G. Hubbard, “Network variability for sensor accuracy and precision: A case study to assess atmospheric variability in simple terrain,” International Journal of Climatology 28 (2008): 267– 272. doi: 10.1002/joc.1565.
Meeting the Needs of Stakeholders
The stakeholders for your mesonet become more apparent as you set your objectives. Ultimately, the deliverables of your mesonet (such as data products) are meant to benefit someone in some way. Those who benefit are your stakeholders and most likely have recommendations as to which measurements should be made, what deliverables they need, what format the deliverables should be in, how often they need the deliverables, etc. Moreover, your stakeholders may have a vested interest in the siting of your network of stations so that the most representative data is obtained, thus providing the most benefit.
Mesonet stakeholders play a key role in helping to define the deliverables that the mesonet must contribute to. Given the nature of a mesonet, there are many data products that can be derived from the core set of standard mesonet station measurements (air temperature, relative humidity, wind direction and speed, solar radiation, barometric pressure, rainfall amount, soil moisture, and temperature).
Because of the variety of parameters that a mesonet measures, your group of stakeholders might be quite diverse. Fortunately, many of the same measurements can be used to serve the data needs of multiple stakeholders. Acquiring unique measurements for key stakeholders should be well planned with respect to financial, operational, and management considerations before deployment. The need for, and feasibility of, these unique measurements should be assessed periodically.
Even though your objectives may have focused on providing deliverables to a couple of stakeholders, you may quickly discover that your mesonet can benefit many more stakeholders. Moreover, as your mesonet produces data products, you may find that more potential stakeholders want to be involved in your project and thereby benefit. While this may seem to make the mesonet planning process more complex, having more people who are supportive of your mesonet can be advantageous for establishing partnerships and providing funding for new site development, as well as for providing funding for ongoing maintenance and operation.
A single mesonet, for example, may benefit stakeholders with the following interests:
- Agricultural management
- Climate analysis and weather forecasting for both commercial and governmental entities
- Emergency response and management
- Meteorological education at all levels
- Scientific research in disciplines ranging anywhere from archaeology to zoology
Betsy Van der Veer Martens, Christopher A. Flebrich, and Bradley G. Illston, “Mapping Oklahoma Mesonet Sensor Datastreams” (poster presentation at 2015 Annual Meeting of the Association for Information Science and Technology, St. Louis, Missouri, November 6-10, 2015). https://wordpressstorageaccount.blob.core.windows.net/wp-media/wp-content/uploads/sites/946/sigmet2015_paper_2.pdf.
Data as a Mesonet Deliverable
The most popular type of mesonet deliverable is a data product. Data products, as related to mesonets, are compilations of data formatted to be of the most benefit for the intended stakeholder. Data products and data formats can vary greatly depending on the individual stakeholder and use of the data. For example, to meet the needs of their industry, growers, farmers, and consultants may only need to see graph or table data posted on a website daily or weekly, in addition to periodic summarized trends. Weather services, however, may desire access to live data in formats that are easy to input into their forecasting models. Emergency managers, on the other hand, may only need rapid data updates (perhaps as often as once per minute) during unusual or severe-weather events.
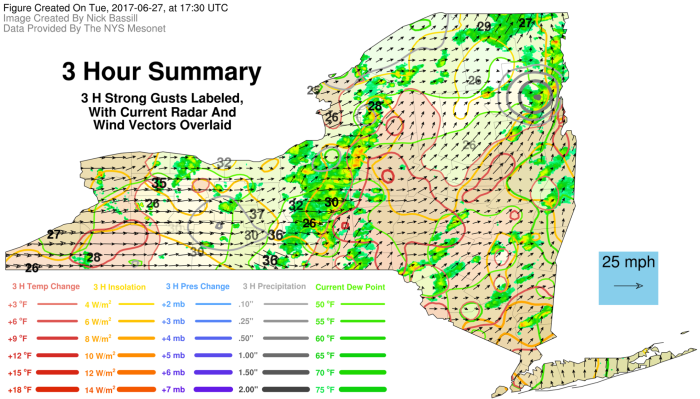
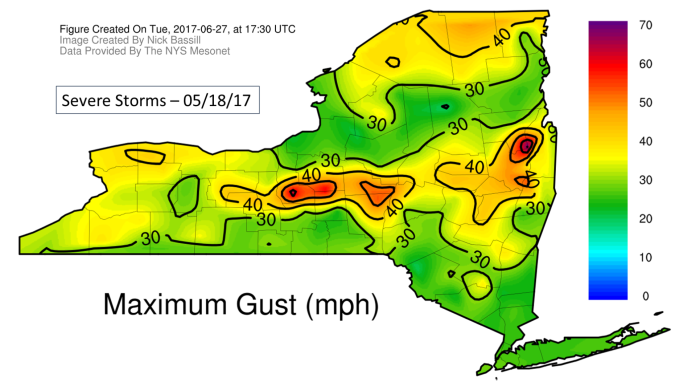
Data products may include pure textual data (such as a list of temperatures throughout the day) or a visual representation of the data (such as a map showing the current temperatures at each automated weather station site). Plots, graphs, tables, maps, and photos are common visual tools for data products.
The following are some examples of visual tools for mesonet data products:
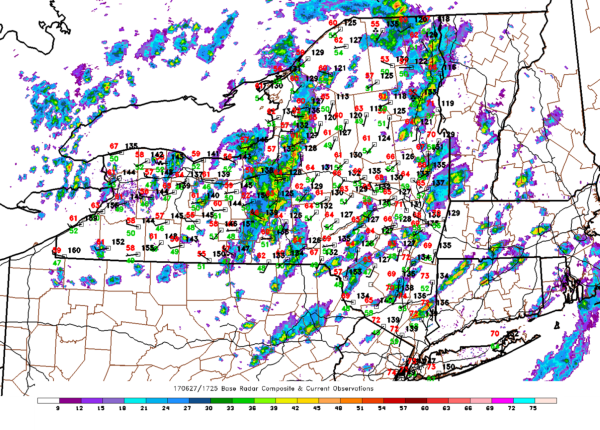
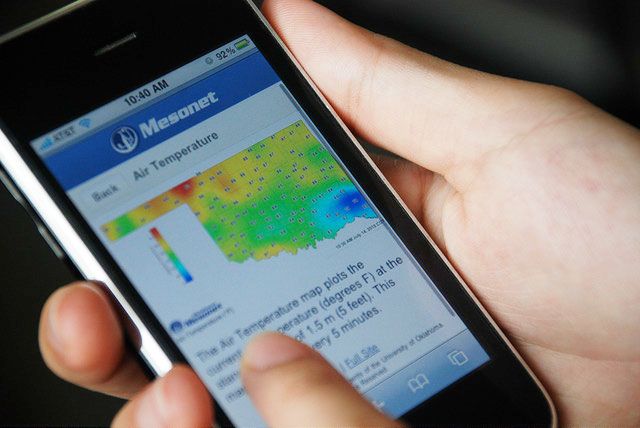
For mesonets that were established in conjunction with land-grant institutions, their stakeholders tend to be in the agricultural industry. Consequently, these mesonets provide data products that focus on evapotranspiration (ET), growing degree days (GDD), and disease model forecasting. Moreover, with the availability of telecommunication, real-time data, and computed data products in map and tabular formats, not only do crop growers benefit, but so can public safety officials and weather forecasters. Mesonet data products can be accessed via personal computers, as well as through mobile device apps.
Tip: At the end of each month, you may want to reprocess your data to look for subtle biases in the data set. Encourage your stakeholders to download the latest data product version that has been rigorously evaluated through quality-review algorithms, as some of your stakeholders may have archived your mesonet data in their systems.
Quality Data Products from Quality Mesonet Equipment
High-quality equipment should be selected to provide the best measurements relative to the mesonet project’s budget. The responsibility for quality assurance of the data (and the resultant data products), however, doesn’t end there. The use of robust equipment (that can minimize downtime) needs to be supported by the regular maintenance and calibration of the equipment. Sensors, for example, can be affected by fouling, soiling, and severe weather events. Without periodic upkeep and data reviews, you may not realize that your sensors are providing questionable or inaccurate data, which you are then passing on to your stakeholders in the form of inaccurate data products.
As an example, the U.S. Climate Reference Network (USCRN) uses approximately 70% of its budget to perform regular checks and maintenance on their automated weather stations, thus ensuring data quality and accuracy. For the USCRN, the degree of accuracy of their equipment can be extremely important—more so, perhaps, than for a crop grower knowing when to irrigate.
Regarding the importance of quality equipment, the WMO offers this:
The most important requirements for meteorological instruments are the following: (a) Uncertainty, according to the stated requirement for the particular variable; (b) Reliability and stability; (c) Convenience of operation, calibration and maintenance; (d) Simplicity of design which is consistent with requirements; (e) Durability; (f) Acceptable cost of instrument, consumables and spare parts. With regard to the first two requirements, it is important that an instrument should be able to maintain a known uncertainty over a long period. This is much better than having a high initial uncertainty that cannot be retained for long under operating conditions. Initial calibrations of instruments will, in general, reveal departures from the ideal output, necessitating corrections to observed data during normal operations. It is important that the corrections should be retained with the instruments at the observing site and that clear guidance be given to observers for their use. Simplicity, strength of construction, and convenience of operation and maintenance are important since most meteorological instruments are in continuous use year in, year out, and may be located far away from good repair facilities. Robust construction is especially desirable for instruments that are wholly or partially exposed to the weather. Adherence to such characteristics will often reduce the overall cost of providing good observations, outweighing the initial cost.
Andrea Merlone, Chiara Musacchio, and Francesca Sanna, “The Metrology for Meteorology Conference: MMC 2014,” Meteorological Applications, 22, no. S1 (2015): 817.
"Guide to Instruments and Methods of Observation (WMO-No. 8)." World Meteorological Organisation: Geneva, Switzerland (2021). https://community.wmo.int/en/activity-areas/imop/wmo-no_8.
How Mesonet Data Products Are Used
Mesonet data products are used in a wide variety of applications for decision making.
More common applications
Some common application examples are described below.
Agriculture
Agricultural data products may include the following:
- Real-time evapotranspiration and 10-inch soil moisture conditions for planting
- Growing degree day (GDD) heat units
- Drift risks for spraying decisions
- Animal heat indices
- Drought prediction with a historical perspective
The temperature and humidity in the atmosphere often dictate whether it is advisable to apply fertilizer or pesticides.
Resource: For more information about the use of drought-related data, see the National Integrated Drought Information System (NIDIS) site: www.drought.gov/drought/.
Weather
Timely, accurate mesonet data are used in weather applications to make more informed decisions that safeguard the lives of people and property. Meteorologists use the high-resolution, real-time mesonet data to issue fire, flood, freeze, and severe weather warnings. With multiple mesonet stations reporting the weather data, meteorologists can determine whether, for example, it is appropriate to issue a thunderstorm warning or a tornado warning for a particular area. Agencies can more precisely assess the impact of current weather conditions and rapidly determine the need to evacuate a municipality to minimize the loss of life.
Real-time data products often include air temperature, relative humidity, 24-hour rainfall, wind gust, barometric pressure, and solar radiation.
Air temperature data products may focus on the following:
- The day’s maximum and minimum
- Three-hour and 24-hour temperature changes
- The maximum and minimum wind chill or heat index
Rainfall data products may include the following:
- The day’s rainfall
- Rainfall summaries
- The number of consecutive days with less than 0.1 and 0.25 inches of rainfall
- Recent rainfall table
- Monthly rainfall table
- Rainfall accumulations periods of 1, 3, 6, 12, and 24 hours
- Rainfall accumulation periods of 1, 2, 3, 4, 5, 7, 10, 14, 30, 60, 90, 120, 180, and 365 days
Wind data products may provide the following:
- Wind speed gusts
- Wind direction
- The day’s maximum wind gusts
- Severe winds
- Dispersion conditions and winds
Dew point and humidity data products may focus on the following:
- Relative humidity
- Three-hour humidity change
- Dew point temperature
- One-hour and three-hour dew point temperature changes
- Dew point depression
- 24-hour dew point temperature change
Resource: For more information about weather-related applications and data products, see the Oklahoma Mesonet site: www.mesonet.org/index.php/weather/category.
Climate change
Annual averages and extremes data products are often reviewed in terms of the following:
- Temperature
- Precipitation
- Snowfall
- Last freeze
- Average length of growing season
- Earliest autumnal freeze
Monitoring weather for a long duration can help determine if, and to what extent, climate change is occurring in a specific region.
Forecasting
Meteorological data products are used for models that predict severe weather conditions such as tornadoes.
Public safety
Decision makers in local government often use the following real-time data products for extreme weather events:
- Precipitation
- Air temperature
- Barometric pressure
- Wind speed and direction
- Water level
Current weather conditions help emergency rescuers determine if it is safe to deploy after a significant weather event such as a hurricane or tornado.
Fire management
Wildland fire management personnel use fire danger-related data products to support their decisions:
- Air temperature
- Relative humidity
- Wind speed and wind direction at 10 m above ground
- 24-hour rainfall
- One-hour and 10-hour fuel moisture
When the relative humidity is low and the winds are strong, conditions are favorable for brush fires. Fire crews depend on these data products so that they know when to be on high alert.
OK-FIRE, a program of the Oklahoma Mesonet, is described as the following:
…has a three-fold emphasis: (1) a comprehensive suite of products for fire weather, fire danger, and smoke dispersion which incorporate an 84-hour predictive component; (2) a dedicated OK-FIRE wildland fire management web site to act as the delivery mechanism for the above products; and (3) regional training and customer support activities for users.
Additional applications
Some less-common application examples are described below.
Ecosystem monitoring
Aquatic wildlife is sensitive to temperature and water quality, which are controlled by rainfall run-off and wind speed.
Seafood industry
Rainfall and wind affect the water quality, which in turn affects the spawning grounds and safety of sea fish and shellfish. Other relevant data products include the level of nitrates and phosphates from the agricultural industry, as well as algal blooms.
Recreation
Current weather conditions can determine the feasibility of outdoor activities such as fishing, golf, and hiking.
Air quality and health
The local wind flow directly affects the dispersion of dangerous chemicals from accidental release at local chemical plants, as well as the distribution of pollutants, ozone, and pollen.
Litigation
Precise meteorological data, combined with human expertise from certified consulting meteorologists or climatologists, make for defensible results that may be used in settling legal conflicts related to weather events.
General public
The weather is often a topic of conversation among the general public. People often discuss the current weather conditions, recent changes they’ve noticed, and information they’ve heard or seen in weather forecasts. From the backyard gardener to the weekend warrior or wedding planner, we all interact with weather every day and look to local sources for this information. Some local sources providing weather updates to the general public may include mobile apps featuring data from mesonet websites.
Media outlets
As the popularity of mesonets increases and the value of mesonet data products is realized across a broad base of the public, news media organizations (such as radio and television stations) may opt to include the data in their forecasts.
Example: The following link is an example of a local TV news station using Kentucky Mesonet data for their forecasts: https://wkunews.wordpress.com/2017/02/17/mesonet-wevv-2017/.
National Weather Service
The National Weather Service (NWS) uses mesonet data as part of the National Mesonet Program to fill gaps in their coverage of the United States. For example, the NWS uses hydrological information provided by the New York State Mesonet.
The NWS, as a stakeholder in mesonets, provides considerable funding for mesonets and also advises on station siting and particular parameters to measure.
Other Mesonet Deliverables
In addition to data products, mesonets are valuable for other purposes and outputs.
Ground-truthing satellite and remote sensing platforms
SMAP (Soil Moisture Active Passive) is a polar-orbiting observatory that uses satellite-based radar and radiometer imagery of the earth to monitor soil moisture on the top layer of soil. To calibrate its instruments and validate that the data are accurate, SMAP uses in situ surface soil moisture measurements. This is called ground-truthing. SMAP uses data from mesonets as part of its ground-truthing procedures.
Environmental and scientific research
Most mesonets in the U.S. are operated by universities, which lend themselves to be a testbed for various environmental science projects and research studies. The historical data produced by those automated weather stations is also useful for research into climate, meteorology, hydrology, agriculture, biological engineering, ecology, and various other disciplines.
STEM programs and K-12 educational resources
Mesonet data products are often used in a variety of educational settings such as the following:
- Weather camps
- Learning activities that use real-time environmental data
- Educational curriculum
- STEM
Example: The Oklahoma Mesonet offers a summer camp: www.mesonet.org/index.php/earthstorm/page/summer_camp/high_school.
Internships and future career paths
The New York State Mesonet offers internship programs for credit to students working in its Operations Center. Students gain experience working with weather instruments, quality control software, and networking.
The Oklahoma Mesonet also offers internships.
C. A. Doswell III and M. J. Haugland, “A comparison of two cold fronts - Effects of the planetary boundary layer on the mesoscale,” E-Journal of Severe Storms Meteorology 2 (2007): 1-12.
"K-12 Resources," Board of Regents of the University of Oklahoma, accessed June 22, 2017, http://www.mesonet.org/index.php/earthstorm.
Emmanouil N. Anagnostou, Viviana Maggioni, Efthymios I. Nikolopoulos, Tadesse Meskele, Faisal Hossain, and Anastasios Papadopoulos, “Benchmarking high-resolution global satellite rainfall products to radar and rain-gauge rainfall estimates," IEEE Transactions on Geoscience and Remote Sensing 48, no. 4 (2010): 1667-1683.
H. Jiang and S. Islam, “An intercomparison of regional latent heat flux estimation using remote sensing data,” International Journal of Remote Sensing 24 (2003): 2221-2236.
“Internships in Atmospheric Science and Environmental Science,” College of Arts and Sciences, University at Albany, accessed June 20, 2017, http://www.albany.edu/caspublicengagement/daes-internships.shtml.
J. D. Carlson, E. S. Krueger, D. M. Engle, and T. E. Ochsner, “Comparison of a Soil Moisture Surrogate (Keetch-Byram Drought Index) with In-Situ Measured Soil Moisture as a Predictor of Wildfire Danger in Oklahoma” (presentation at 23rd Conference on Applied Climatology, Asheville, North Carolina, June 26, 2017). https://ams.confex.com/ams/23Applied/webprogram/Paper318656.html.
J. D. Carlson, J. Edwards, R. Jabrzemski, N. Bain, and A. Sutherland, “Using In-Situ Measured Soil Temperature to Predict First Hollow Stem, a Critical Growth Stage for Removal of Cattle in Dual-Purpose Winter Wheat” (presentation at 23rd Conference on Applied Climatology, Asheville, North Carolina, June 27, 2017). https://ams.confex.com/ams/23Applied/webprogram/Paper318660.html.
“Clymer Central School Hosts New Mesonet Site.”https://www.post-journal.com/news/local-news/2016/06/clymer-central-school-hosts-new-mesonet-site/.
L. Dente, Z. Vekerdy, R. de Jeu, and Z. Su, “Seasonality and autocorrelation of satellite-derived soil moisture products,” International Journal of Remote Sensing 34 (2013): 9-10, 3231-3247. doi: 10.1080/01431161.2012.716923.
“Meteorology Advising Guide,” University of South Alabama, accessed June 20, 2017, https://www.southalabama.edu/departments/academicadvising/firstyear/advisingguides/artsandsciences/meteorology.html.
Michael H. Cosh and Tyson Ochsner, “Early Results of the Soil Moisture Active Passive Marena Oklahoma In Situ Sensor Testbed (SMAP-MOISST)” (2012). https://ecommons.cornell.edu/bitstream/handle/1813/29604/I2_Cosh_poster.pdf?sequence=2&isAllowed=y.
Michael H. Cosh, Tyson Ochsner, Jeff Basara, and Thomas J. Jackson, “The SMAP in situ soil moisture sensor testbed: Comparing in situ sensors for satellite validation,” Geoscience and Remote Sensing Symposium (IGARSS), 2010 IEEE International: 699-701.
“Mission Description,” SMAP Soil Moisture Active Passive, accessed June 19, 2017, https://smap.jpl.nasa.gov/mission/description/.
Rachel T. Pinker, Donglian Sun, Meng-Pai Hung, Chuan Li, and Jeffrey B. Basara, “Evaluation of satellite estimates of land surface temperature from GOES over the United States,” Journal of Applied Meteorology and Climatology 48, no. 1 (2009): 167-180.
Renee A. McPherson and Kenneth C. Crawford, “The EARTHSTORM Project: Encouraging the Use of Real-Time Data from the Oklahoma Mesonet in K-12 Classrooms,” Bulletin of the American Meteorological Society: 749-761. http://journals.ametsoc.org/doi/pdf/10.1175/1520-0477(1996)077%3C0749:EA%3E2.0.CO%3B2.
“Summer Camp,” Board of Regents of the University of Oklahoma, accessed June 19, 2017, http://www.mesonet.org/index.php/earthstorm/page/summer_camp/high_school.
Suzanne W. Smith, Phillip B. Chilson, Adam L. Houston, and Jamey D. Jacob, “Catalyzing Collaboration for Multi-Disciplinary UAS Development with a Flight Campaign Focused on Meteorology and Atmospheric Physics,” AIAA Information Systems-AIAA Infotech@Aerospace (2017): 1156.
T. R. Holmes, T. J. Jackson, R. H. Reichle, and J. B. Basara, “Validation of soil temperature dataset against ground measurements in Oklahoma,” AGU Fall Meeting Abstracts 1 (2009): 7.
W. J. Riley, S. C. Biraud, M. S. Torn, M. L. Fischer, D. P. Billesbach, and J. A. Berry, “Regional CO2 and latent heat surface fluxes in the Southern Great Plains: Measurements, modeling, and scaling,” Journal of Geophysical Research 114 (2009): G04009.
“Weather Stations Installed at Public K-12 Schools Around the State,” Missouri EPSCoR, accessed June 20, 2017, https://missouriepscor.org/highlights/weather-stations-installed-public-k-12-schools-around-state.
William Woodley, “Investigating the upscaling of in situ soil moisture measurements for satellite validation” (PhD diss., University of Guelph, 2017).