Mesonet Network Design
Mesonet Boundaries
Generally speaking, the boundaries of your mesonet will be determined by the needed mesonet products, geographic boundaries, and the funding sources for your project. For example, because many mesonets receive significant funding from universities and state governments, their boundaries often follow the state boundary lines. There are, however, other networks of automated weather stations that cross state boundaries for a variety of reasons, such as multi-state land being owned by the same landowner, similar neighboring stakeholders requiring similar data products, etc.
Fortunately, there are regional climate centers, such as the Midwestern Regional Climate Center (MRCC), that can merge data from your mesonet (no matter what its boundaries) with nearby mesonet data to create and distribute regional data.
Considerations for Selecting Station Sites
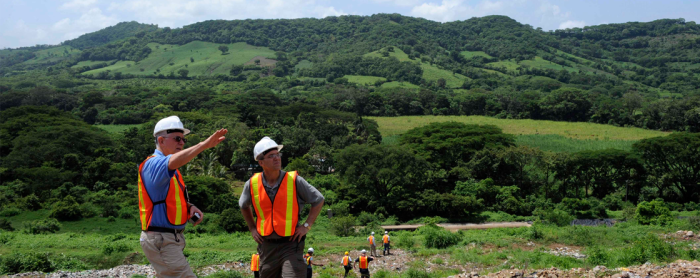
After you have roughly plotted the locations for the automated weather stations in your mesonet, you’ll need to determine the ideal location for your stations. Identifying site locations for the stations can be a time-consuming task, as several of your first-choice location options may not be deemed feasible after more thorough consideration and investigation. For example, there may be accessibility issues or additional costs for a location that would complicate your maintenance of the site or significantly impact your operation cost.
As you can imagine, there are numerous considerations for this process, and each mesonet will have some unique issues. The considerations discussed in this section are meant to provide you with some of the more common issues that mesonet planners face.
An ideal location
In a perfect world, ideal locations would exist for all your mesonet stations. Unfortunately, we don’t live in a perfect world.
Every attempt should be made to locate new stations in "ideal" locations. The ideal location would be a site with a large flat fetch with short vegetation. However, existing stations in most cases are compromised in one or more ways. Quite often the selection of the site is negotiated with a landowner, which means that the station cannot be located at the ideal site. If phone service or AC power is required to power the station, then the likelihood of some obstruction affecting the station is greatly increased. Therefore, a complete description of any obstructions that are closer to the anemometer tower than 30 times the height of the obstruction should be developed (Oke, 1978). Even "ideal" locations should have a site description so that it is clear that there are no obstructions. With the availability of solar panels to provide power for the instruments, and the new bandwidth technology for improved communication for data retrieval, selection of more ideal sites should be possible.
Not an ideal view for some
It's important to be sensitive to the human impact of viewsheds. While meteorologists may not mind a 30-foot tower on their property, many homeowners do not enjoy gazing upon a weather station from their living room window. In addition, a historical society or local community may not be in favor of siting a mesonet station in full view from a historical property.
Accurate representation and desired mesonet products
Your first consideration may very well be to determine which sites will provide you with an accurate representation of the setting and meteorological phenomena you want to monitor and measure. Your data should accurately reflect the reality of the region to ensure you can meet the objectives of your mesonet project.
The cornerstone of site selection requirements is to determine the purpose of the data to be collected from the site. For example, if the data will be used in agricultural applications, then the site should represent an agricultural setting.
Accurate representation plays a significant role in agricultural applications.
Collection of representative meteorological data is critical to agricultural applications. Therefore, careful attention must be paid to where a station is located within a region or landscape. Where a station should be located is dependent on the purpose for which the meteorological data are being collected. If the purpose of the data is to infer weather conditions at locations remote from the site, then the station should be located in an area representative of the general region.
Reviewing the needs of the mesonet stakeholders and the resultant needed mesonet products is critical. If your sites won’t capture all the needed data to meet your objectives, you’ll need to reconsider your site selections. Alternatively, you may need to reevaluate the importance of your objectives and possibly revise them. The Oklahoma Mesonet faced a similar challenge:
In the early stages of the project, consideration was given to locating sites near lakes or rivers to monitor hydrologic conditions. Included in this consideration was placement of sites to monitor stream stage, lake levels, ground-water levels, and surface and ground-water quality. It was found that satisfying hydrologic criteria would in many cases compromise criteria set for meteorological or agricultural uses.
Advertising
Using the local farm bureau to post notices about your need for site hosts may be a helpful tactic. The New York State Mesonet used this approach:
The NYS Mesonet is now ready to begin installing sites. The Mesonet will break ground on its first site this month, with about a third of the network installed this summer and fall. The entire system is expected to be completed and fully operational by Dec. 31, 2016. So far, about half of the 125 stations have been selected, and the goal is to select all the sites by the end of the year. If you have plenty of open land and are interested in hosting a permanent site, please contact us at (518) 442-MESO.
Accessibility and land ownership
Accessibility is of great concern to mesonet planners. You’ll need to have year-round access to your sites so that you can maintain them. For example, if a site is only accessible via a seasonal road, you will be unable to maintain your station for part of the year.
Land ownership is another issue that ties in with accessibility. Consider whether permission to operate the site on the property is affected by property ownership. In an ideal world, the land that hosts your stations would never be sold to another landowner, and you would have an agreement that would ensure your stations are never torn down, fenced off, etc.
Keep in mind that the landowner can restrict where you station is located on the land.
A factor that often drives station site selection is the ability of the site host to support the station for years to come. Often, this means that the host (public or private) must agree to the location of the station. The sensors cannot interfere with other activities at the location, such as crop management (planting, irrigation, harvest protocols and equipment), airport flight operations, or water treatment. Occasionally, Mesonet stations must also meet aesthetic requirements of the host, as not all potential site hosts find these stations visually pleasing.
Working with landowners to select sites can be a positive experience. Mark Shafer, Director of Climate Services at the Oklahoma Climatological Survey, had this to say:
We would meet with the landowner and when we found a site acceptable to them and suitable for our criteria, we pounded in a wooden stake painted bright orange at the top so the technicians would know where to install it.
Household harmony
When considering your station sites, be sensitive to all household members that may have input on the use of their land for hosting a station. For example, while one spouse may like the idea of hosting a site, not all family members may agree.
Proximity
As you pinpoint the exact location for an automatic weather station site, remember to consider the location of the nearest sites that have already been selected. Hubbard and Hollinger offer this:
Where is the site in relation to other AWS stations? Stations that are located in proximity may have too much redundancy. On the other hand, accuracy checking improves as the separation distance decreases. National and regional databases would help to avoid duplication. The database might include ownership, operational contacts, accessibility, geographical coordinates, and the sensors and data collection frequency. The WMO guidelines may serve as a good starting point for site requirements, and managers could alter or add requirements as needed to meet the specific project needs.
Clearance and obstructions
Adequate clearance around the sites is highly important. For example, your sites should have limited vertical obstructions, such as trees or buildings, so that your wind and precipitation measurements are not impacted or obstructed. Hubbard and Hollinger discuss this topic in more detail:
Ideally, a station should be located in an open area where the instruments are not affected by vegetation or manmade obstructions…The vegetation over which the instruments are located should represent the general vegetation of the area. In most cases the ideal surface is a grass surface with the grass maintained at a height not to exceed 10 cm; however, if the station is located in a desert area, the surface under the instruments should be left bare. In all cases, the vegetation should be maintained at a height such that the instruments that measure atmospheric variables (temperature, precipitation, relative humidity, solar radiation) are located approximately 1 to 2 m above the top of the vegetation. When measuring wind and solar radiation, care must be taken to ensure that the instruments are not shaded by manmade structures or tall vegetation. The dome of the radiometers used to measure solar radiation should have a clear view of the horizon and the sky in all directions. This is often not possible because of the structures necessary to mount all the instruments at a station. Generally, obstructions to radiation measurements will not be a problem if the obstruction does not occupy > 1% of the sky hemisphere. Siting of wind instruments is critical to accurate measurement of synoptic winds. Standards for wind instrument siting are provided by the World Meteorological Organization (WMO, 1996). Hollinger and Scott (2001) describe effects of obstructions on wind measurements at some automated stations in Illinois.
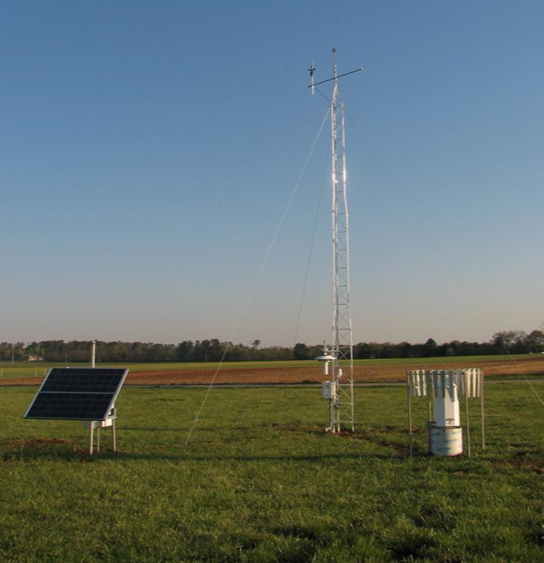
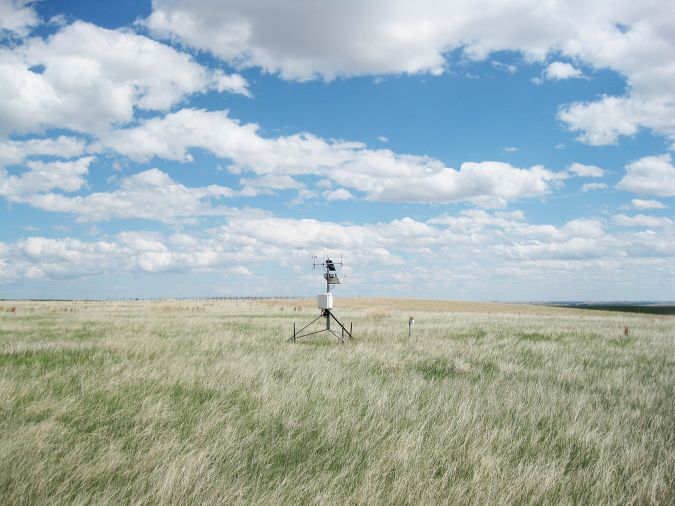
A mesonet station in Kentucky with good exposure
(Image courtesy of Dr. Rezaul Mahmood, Associate Director, KY-Mesonet)
Wind obstructions can play a critical role in selecting sites and attaining representative data. Hollinger and Scott provide considerable information on this topic:
The effects of topography and obstructions can result in significant differences in wind observations at neighboring or distant stations in a weather station network. These effects make it difficult to make comparisons of wind data between stations. Application of the wind data to areas between the stations, a practice often required when evaluating wind damage, chemical drift, and estimating wind speed at a height different from the measurement for siting wind generators for alternative energy production, is compromised. Detailed descriptions of the topography and obstructions surrounding a weather tower may be used to help remove exposure effects from the wind measurements. Descriptions must include the distance of the obstruction from the tower, the obstruction height and breadth, and the density of the object. Vegetation descriptions in the vicinity of the station must, at the minimum, include height, breadth, and vegetation type (deciduous or evergreen). Examples from the Illinois Climate Network show the importance of selecting the appropriate site for a station to minimize the exposure effects of topography, buildings, trees, and other obstructions. Although failure to minimize these effects may limit the application of the data, it does not invalidate the data collected at the site.
The objective of a single weather station is to measure weather conditions at a specific location. Station networks include this objective and the objectives of comparing weather at different stations and interpolating weather conditions between stations. When wind is being measured at a single station solely to characterize the wind at that location and at the height of the instrument, no additional observations need to be made. However, application of wind observations at a given location often requires estimating wind speeds and directions at different heights and locations in the area surrounding the weather tower. Therefore, a station site must be characterized by its surroundings to understand how obstructions affect the wind flow at the station.
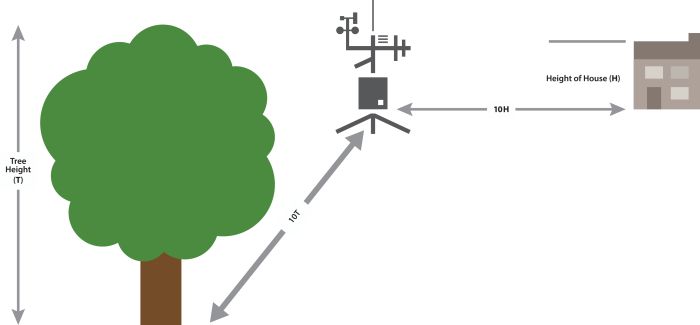
The World Meteorological Organization standards (WMO, 1983) require that wind measurements for synoptic purposes be measured at, or referenced to, a height of 10 meters (m) over open terrain. Open terrain is defined as an area where the distance between the anemometer and obstructions is at least ten times the height of the obstructions. With these standards, an acceptable site can be found in most areas. However, studies by Schmid and Oke (1990) and Wieringa (1992) show that large obstructions and terrain changes as far away as 5 km can affect the wind flow at a station. Thus, stations that meet the WMO synoptic standard may not truly represent the synoptic wind in a region.
Level ground
Each site should be on level ground (as much as possible) and away from obstacles and obstructions that could affect the measurements.
Flood risk and federal and/or state siting requirements
Refer to FEMA’s “Guidelines and Standards for Flood Risk Analysis and Mapping” web page (www.fema.gov/guidelines-and-standards-flood-risk-analysis-and-mapping) for the statutory and regulatory requirements for mapping. It may not be possible to use station sites that are considered to be in flood zones.
The primary mission of the New York State Mesonet is for use in emergency management. Thus, they had to ensure that their stations were not located in flood-prone areas. In addition, they installed several redundancies (backup power and communications) to ensure that their stations would continue to operate during emergencies.
Transmission
Two-way data communication is a key attribute of a mesonet. If cellular transmission of the mesonet data will be used, ensure each site has a strong cellular signal for reliable transmission. Grant and Toby offer the following advice:
To evaluate whether cellular communications is a possible solution to automated weather station communications, determine (1) if the right kind of cellular service (analog or digital (ed – 1XRTT to 4G) is available in the area of the AWS site, (2) what waveband the cellular provider uses, (3) whether there is a cell tower in line of sight and within 16 km of the AWS site, and (4) whether you have sufficient power at the site to meet the needs of the communications equipment.
Location types
Some location types may be more ideal than others for your mesonet. The following are some examples:
- Staff from the New York Mesonet suggested that using sites on a university campus may be problematic because future growth may cause university officials to add buildings or repurpose the land.
- Flood plain locations may be problematic in severe weather conditions.
- While airports may follow good siting requirements, there may be considerable administrative red tape to work through.
- The U.S. Climate Reference Network (USCRN) uses public lands (national parks and forests) and universities for its sites.
- The New York State Mesonet worked with the agricultural industry to identify possible sites. They worked through university extensions to spread the word to solicit site hosts. After site hosts were found, possible locations were identified and then visited for surveying and determining suitability.
- The availability of public versus private land may depend on the region and whether the stations would constitute undesirable viewsheds.
The Oklahoma Mesonet offered this information about its site selection:
The first sites to be selected were those on OSU or OU research land, primarily at OSU agriculture research stations. Many sites are located on property owned by federal, state or local government, academic institutions or foundations…About half of the site locations are on privately owned land. The land owners have loaned a parcel of their land – free of charge – for use by the Mesonet.
Standards
Some standards for mesonets have been formally outlined:
…stations are often placed in locations that best achieve the following objectives (AASC 1985; EPA 1987; WMO 1983; WMO 2008; LeRoy 2010):
- Maximize airflow for naturally aspirated temperature, humidity, and pressure sensors.
- Minimize nearby obstructions to ensure accurate radiation measurements.
- Minimized wind flow around the precipitation gauge.
- Ensure soils are representative of the surrounding region.
- Maximize distance from tall obstructions (e.g., buildings and trees) to ensure accurate wind measurements that are often recorded at 2, 3, 5 and/or 10 m above ground. One rule of thumb is that the minimum desired distance between a tall object and a station is about 10 times the height of the object.
- Maximize long-term stability of surrounding land cover.
- Maximize site host’s ability to support the station over the long-term. Radiation, temperature, humidity, wind and pressure sensors typically require open exposure, with no obstruction to incoming radiation or airflow.
- Station siting requirements also must consider needs for power and communications. Some Mesonet stations require access to AC power, particularly to meet the power demands of aspirated temperature shields and sensors with heating elements. However, many mesonet stations use only solar panels to power sensors (including aspirated shields), data logger, and communication subsystems. In either case, mesonet stations typically use power sources interfaced with trickle-charge batteries, providing stored energy capacity. Also, as wireless cellular communications networks become more pervasive and cost-effective, many mesonets make siting decisions based on access to these networks.
One approach
As you can see from these considerations, selecting sites can be a difficult and time-consuming process. The Oklahoma Mesonet followed this process:
The site selection process encompassed (1) developing a list of potential site locations, (2) soliciting other agencies for input regarding their needs for environmental data in localized areas of the state, (3) seeking assistance on the local level for finding suitable sites, (4) contacting the individual landowners and (5) executing a land-use agreement.
References (13)
On-Site Meteorological Program Guidance for Regulatory Modeling Applications, EPA-450/4-87-013 (Environmental Protection Agency, 1987).
R. Mahmood, R. Boyles, K. Brinson, C. Fiebrich, S. Foster, K. Hubbard, D. Robinson, J. Andresen, and D. Leathers, “Mesonets: Mesoscale Weather and Climate Observations for the U.S.,” Bulletin of the American Meteorological Society. http://journals.ametsoc.org/doi/pdf/10.1175/BAMS-D-15-00258.1.
Steven E. Hollinger and Robert W. Scott, “Station Wind Characterization,” Automated Weather Stations for Applications in Agriculture and Water Resources Management: Current Use and Future Perspectives (proceedings of an international workshop, Lincoln, Nebraska, March 6-10, 2000): 63-75. http://www.wamis.org/agm/pubs/agm3/WMO-TD1074.pdf.
Michel Leroy, “Siting Classification for Surface Observing Stations on Land” (presentation at JMA/WMO Workshop on Quality Management in Surface, Climate and Upper-air Observations in RA II [Asia], Tokyo, Japan, July 27-30, 2010). http://www.jma.go.jp/jma/en/Activities/qmws_2010/CountryReport/CS202_Leroy.pdf.
"Guide to Instruments and Methods of Observation (WMO-No. 8)." World Meteorological Organisation: Geneva, Switzerland (2021). https://community.wmo.int/en/activity-areas/imop/wmo-no_8.
R. H. Grant and D. Toby, “Cellular Communications for Automated Weather Stations,” Automated Weather Stations for Applications in Agriculture and Water Resources Management: Current Use and Future Perspectives (proceedings of an international workshop, Lincoln, Nebraska, March 6-10, 2000): 41-48. http://www.wamis.org/agm/pubs/agm3/WMO-TD1074.pdf.
Muhammad Ashraf, Jim C. Loftis, and K. G. Hubbard, “Application of geostatistics to evaluate partial weather station networks,” Agricultural and Forest Meteorology 84 (1997): 225-271. https://www.sciencedirect.com/science/article/pii/S0168192396023581.
Campbell Scientific, Inc., "Weather Station Siting and Installation Tools" application note (1997). https://s.campbellsci.com/documents/us/technical-papers/siting.pdf.
“Weather Station Siting,” Campbell Scientific, Inc., accessed June 19, 2017, https://www.campbellsci.com/weather-station-siting.
“What is the Oklahoma Mesonet?,” Oklahoma Climatological Survey, 1997. http://www.mesonet.org/files/materials/mesonet.pdf.
K. G. Hubbard and S. E. Hollinger, “Standard Meteorological Measurements,” Micrometeorology in Agricultural Systems 47 (2005). http://digitalcommons.unl.edu/cgi/viewcontent.cgi?article=1695&context=agronomyfacpub.
“AASC Instrumentation and Data Standards Committee Report,” The State Climatologist 9, no. 4 (October 1985): 12-14. http://www.stateclimate.org/sites/default/files/upload/pdf/state-climatologist/00000029.pdf.
Kenneth G. Hubbard and M. V. K. Sivakumar, Automated Weather Stations for Applications in Agriculture and Water Resources Management: Current Use and Future Perspectives (proceedings of an international workshop, Lincoln, Nebraska, March 6-10, 2000). http://www.wamis.org/agm/pubs/agm3/WMO-TD1074.pdf.
Plotting Stations throughout a Mesonet
After the boundaries for your mesonet are established, you’ll need to determine how many automated weather stations you need to adequately cover the area, as well as the appropriate spacing of those stations.
A common trend has been to space the stations one per county for a statewide mesonet. More stations are used in a county when the area encompasses significant geographic differences that could reflect different meteorological phenomena. For example, if a county has both mountainous terrain and lower-elevation pasture land, multiple stations should be used to capture the differing resultant data.
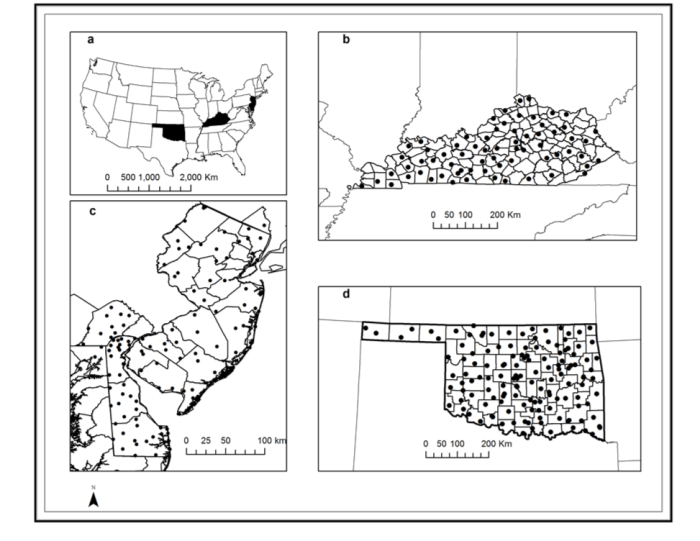
Example of mesonets in the U.S.: a) a map of conterminous U.S. with four states with mesonets (filled in black color), b) Kentucky Mesonet, c) Delware and New Jersey mesonets, and d) Oklahoma mesonet.
(Image courtesy of Dr. Rezaul Mahmood, Associate Director, KY-Mesonet)
When plotting your mesonet’s stations, it may be helpful to also consider the feasibility of your staff members to manage and maintain the network of stations. Obviously, a network with more stations contributes to both the monetary cost and the labor cost. Regarding the cost-benefit analysis relative to the number of stations, this advice is offered:
In questions of network station density, the cost of purchasing and operating stations must be weighed against the incremental value of additional station coverage. It may be possible in some cases to design networks that fulfill the monitoring goal but do not have the same set of sensors at each station site (Ashraf et al., 1997). Questions that should be addressed are "Where within the area of the station network will the data be applied?" and "Are data to be used to integrate up to an aerial average value or will the data be interpolated to non-station sites?" The required station density requirements in these two situations may be quite different.
The spatial characteristics of various weather variables that are measured in an automated weather data network (AWDN) were first described by Hubbard et al. (1983).
The number of needed automated weather stations and their ideal spacing within a mesonet have been the topics of many scientific studies.
Previous studies have examined the role of station density in capturing the spatial variability in the regional data sets. For example, Hubbard (1994) found that one station every 60 km in relatively simple terrain was adequate to capture 90% of the spatial variability in daily temperature. Network resolution for capturing daily precipitation variability was an order of magnitude higher (5 km). Based on an 814-station subset of the US Historical Climatology Network (HCN), DeGaetano (2000) found 321 station clusters represented the spatial variability of seasonal precipitation across the contiguous US. Since 101 of 321 total clusters were single-station clusters and the reference network was spatially coarse in the Western United States, at least 321 stations are necessary to resolve the spatial variability of seasonal precipitation across the contiguous United States. A 250-station network of for the contiguous US, assuming a uniform distribution, is equivalent to approximately one station every 180 km. Comparatively, with 1219 stations for the contiguous US, the HCN has approximately one station every 82 km (Easterling et al. 1996).
While this research might suggest one station per every 60, 82, or 180 km in a mesonet, actual practice has painted a somewhat different picture. For example, the Oklahoma Mesonet consists of 120 stations with an average station separation of only 30 km (19 miles). In the following table, existing mesonets are listed with the number of their stations and their average station spacing (May 2017 Internet searches, Dan Anderson, Campbell Scientific, Inc.):
| Mesonet | Average Station Spacing | Number of Stations |
| Oklahoma Mesonet | 30 km | 120 |
| Kentucky Mesonet | 40 km | 67 |
| U.S. Historical Climatology Network | 82 km | 1219 |
| West Texas Mesonet | 35 km | 98 |
| New York State Mesonet | 30 km | 126 |
| MesoWest | 15 km | 350 |
| New Jersey Mesonet | 15 km | 61 |
| South Alabama Mesonet | 30 km | 26 |
The following illustrations provide examples of station plotting for some existing mesonets.
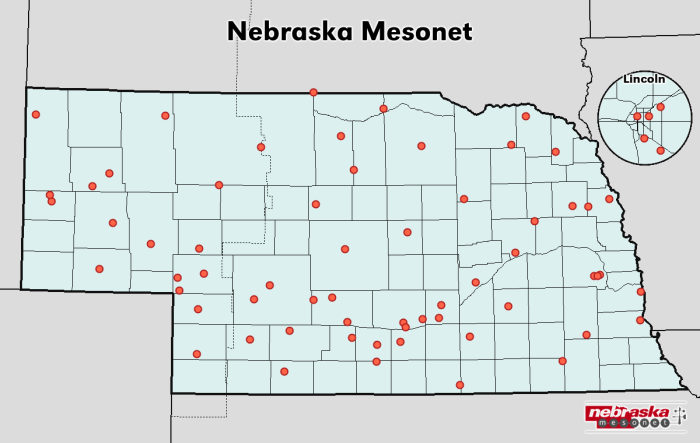
(Image courtesy of Stonie Cooper, Mesonet Manager, Nebraska State Climate Office)
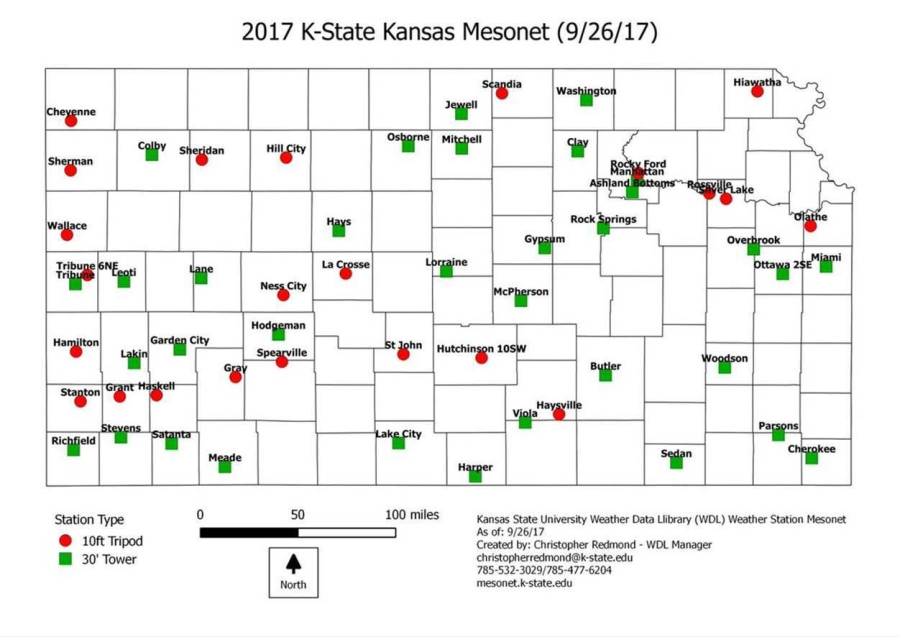
(Image courtesy of Christopher [Chip] Redmond, Assistant Scientist, Kansas Mesonet)
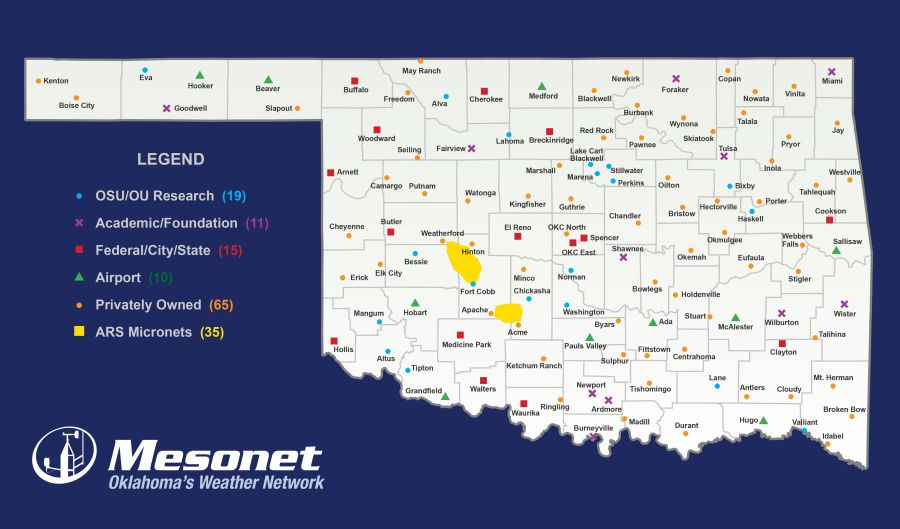
(Image courtesy of Dr. Christopher A. Fiebrich, Executive Director, Oklahoma Mesonet)
Unfortunately, there’s not a simple formula that illustrates how to determine the number of stations you need for your mesonet or how far you should space them apart. Some mesonet planners have approached this dilemma by reviewing their resources and funding and then looking for station sites in each geographic subsection, such as a county, so that they can provide relatively even coverage across their mesonets. Other mesonet planners have taken a different approach by starting with a small number of stations in critical locations based on predetermined criteria such as prevalence of extreme weather, larger populations, land use, etc. These planners then add automated weather stations to their networks, eventually filling out their mesonets with their ideal number of stations and desired spacing.
For your mesonet, it may not be ideal to space your automated weather stations evenly apart. In some areas, it may be more feasible and appropriate to space your stations closer together or farther apart. There are several factors that may influence the spacing of your stations, such as those mentioned in the following examples:
- An area with significant elevation or terrain differences may require more closely plotted stations.
- For areas with terrain that is difficult to traverse or extremely remote, it may be more feasible to plot the stations farther apart.
- Areas with a dense tree canopy may prove difficult for hosting stations, causing the stations to be plotted farther apart.
If you have a region of interest, you may choose to plot several stations more closely together to establish a micronet (microscale network) within your mesonet framework. The Oklahoma Mesonet, for example, has a micronet. As another example, the New York State Mesonet has a LIDAR sub-network, as well as a snow station sub-network.
Several resources discuss the topic of plotting stations in greater detail, focusing on statistics and geo-statistics.
References (12)
Christopher A. Fiebrich and Kenneth C. Crawford, “The Impact of Unique Meteorological Phenomena Detected by the Oklahoma Mesonet and ARS Micronet on Automated Quality Control,” Bulletin of the American Meteorological Society 82 (2001): 2173–2187. http://journals.ametsoc.org/doi/abs/10.1175/1520-0477(2001)082%3C2173%3ATIOUMP%3E2.3.CO%3B2.
J. L. Schroeder, W. S. Burgett, K. B. Haynie, I. Sonmez, G. D. Skwira, A. L. Doggett, and J. W. Lipe, “The West Texas Mesonet: A Technical Overview,” Journal of Atmospheric and Oceanic Technology 22, no. 2 (2005): 211-222. http://journals.ametsoc.org/doi/pdf/10.1175/JTECH-1690.1.
Russell S. Vose and Matthew J. Menne, “A Method to Determine Station Density Requirements for Climate Observing Networks," Journal of Climate 17, no. 15 (2004): 2961-2971. http://journals.ametsoc.org/doi/pdf/10.1175/1520-0442%282004%29017%3C2961%3AAMTDSD%3E2.0.CO%3B2.
Kenneth G. Hubbard, “Station Density and Areal Coverage of Networks,” Automated Weather Stations for Applications in Agriculture and Water Resources Management: Current Use and Future Perspectives (proceedings of an international workshop, Lincoln, Nebraska, March 6-10, 2000): 87-91. http://www.wamis.org/agm/pubs/agm3/WMO-TD1074.pdf.
Michael J. Janis, Kenneth G. Hubbard, and Kelly T. Redmond, “Station Density Strategy for Monitoring Long-Term Climatic Change in the Contiguous United States,” Journal of Climate 17, no. 1 (2004): 151-162. http://journals.ametsoc.org/doi/pdf/10.1175/1520-0442%282004%29017%3C0151%3ASDSFML%3E2.0.CO%3B2.
Kenneth G. Hubbard, N. J. Rosenberg, and D. C. Nielsen, “Automated weather station network for agriculture,” Journal of Water Resources Management 109 (1983): 213-222.
Andrea J. Coop, Kenneth G. Hubbard, Martha D. Shulski, Jinsheng You, and David B. Marx, “Spatial accuracy of climate networks: a case study in Nebraska,” Journal of Applied Meteorology and Climatology 53, no. 8 (2014): 1932-1942. http://digitalcommons.unl.edu/cgi/viewcontent.cgi?article=1590&context=natrespapers.
J. Horel, M. Splitt, L. Dunn, J. Pechmann, B. White, C. Ciliberti, S. Lazarus, J. Slemmer, D. Zaff, and J. Burks, “Mesowest: Cooperative Mesonets in the Western United States,” Bulletin of the American Meteorological Society 83, no. 2 (2002): 211-225. http://journals.ametsoc.org/doi/pdf/10.1175/1520-0477%282002%29083%3C0211%3AMCMITW%3E2.3.CO%3B2.
R. Mahmood, R. Boyles, K. Brinson, C. Fiebrich, S. Foster, K. Hubbard, D. Robinson, J. Andresen, and D. Leathers, “Mesonets: Mesoscale Weather and Climate Observations for the U.S.,” Bulletin of the American Meteorological Society. http://journals.ametsoc.org/doi/pdf/10.1175/BAMS-D-15-00258.1.
Muhammad Ashraf, Jim C. Loftis, and K. G. Hubbard, “Application of geostatistics to evaluate partial weather station networks,” Agricultural and Forest Meteorology 84 (1997): 225-271. https://www.sciencedirect.com/science/article/pii/S0168192396023581.
Arthur T. DeGaetano, “Spatial Grouping of United States Climate Stations Using a Hybrid Clustering Approach,” International Journal of Climatology 21 (2001): 791-807. http://onlinelibrary.wiley.com/doi/10.1002/joc.645/pdf.
K. G. Hubbard, “Spatial variability of daily weather variables in the high plains of the USA,” Agricultural and Forest Meteorology 68, no. 1-2 (1994): 29-41. https://doi.org/10.1016/0168-1923(94)90067-1.
Location, Location, Location
(Photo courtesy of Glen Roebke, Senior Mesonet Technician, Nebraska Mesonet)
Location is not only important in real estate but also when it comes to planning your mesonet. The decisions regarding the location of your mesonet as a whole, as well as the siting for your individual automated weather stations, will be significantly impacted by your mesonet objectives. If, for example, your primary objective is to provide a wealth of meteorological and soil data to crop farmers in a Midwestern state, your mesonet will be in a place that is representative of the data to be acquired—with stations sited in or near farmland throughout a single state.
Station siting is a critical aspect and requires careful planning. Spatial and temporal scales of individual stations require consideration in terms of the deliverables. For example, the automated weather stations may be sited to provide measurement data for use in determining subtle changes in the climate signature. Many factors can affect the individual measurements made for this type of climate research, such as urban creep, land use changes, changes in land ownership (perhaps requiring a long-term station to be moved to a new location), and exposure (growth of a tree line/wind break).
Wind, air temperature, and water vapor pressure measurements are affected by surface type and roughness, soil moisture, regional topography, and obstructions. Sites selected for their applicability to a broader area should be free from obstructions such as buildings, trees, and steep slopes. Ten-meter towers are often used to raise measurement heights above low-lying obstructions. The following table lists the suggested measurement heights and exposure (distance to an obstruction) for each type of sensor.
Suggested Measurement Heights and Exposure
| Sensor Type | Measurement Height or Depth | Exposure Considerations |
| Wind |
| No closer than ten times the obstruction's height |
| Air Temperature and Relative Humidity |
| The sensor must be housed in a ventilated radiation shield to protect the sensor from thermal radiation. The EPA recommends the sensor be no closer than four times the obstruction's height and at least 30 m from large paved areas. |
| Solar Radiation | Height should be consistent with the exposure standard (AASC, WMO, EPA). To facilitate leveling/cleaning, Campbell Scientific recommends installing at a height of 3 m or less. | The sky should not be blocked by any surrounding object. However, objects < 10° above the horizontal plane of the sensor are allowed. |
| Precipitation |
| AASC and EPA suggest the sensor be no closer than four times the obstruction's height. The orifice of the gage must be in a horizontal plane, open to the sky, and above the level of in-splashing and snow accumulation. It is also recommended to use one or preferably two concentric rings of Alter shields around the gage to minimize turbulence. |
| Soil Temperature |
| Measurement site should be 1 m² and typical of the surface of interest. The ground surface should be level with respect to the immediate (10 m radius) area. |
When siting your stations, it’s a good idea to be informed of changes on the horizon that could greatly impact your mesonet. The task of moving one of your automated weather stations after it has been operational for years is no small undertaking.
The World Meteorological Organization (WMO) has this to say about changing site locations:
It is especially important to minimize the effects of changes of instrument and/or changes in the siting of specific instruments. Although the static characteristics of new instruments might be well understood, when they are deployed operationally they can introduce apparent changes in site climatology. To guard against this eventuality, observations from new instruments should be compared over an extended interval (at least one year; see the Guide to Climatological Practices (WMO, 1983) before the old measurement system is taken out of service. The same applies when there has been a change of site. Where this procedure is impractical at all sites, it is essential to carry out comparisons at selected representative sites to attempt to deduce changes in measurement data which might be a result of changing technology or enforced site changes.
The WMO offers the following guidance for station siting:
The characteristics of an observing site will generally change over time, for example, through the growth of trees or erection of buildings on adjacent plots. Sites should be chosen to minimize these effects, if possible. Documentation of the geography of the site and its exposure should be kept and regularly updated as a component of the metadata.
Meteorological observing stations are designed so that representative measurements (or observations) can be taken according to the type of station involved. Thus, a station in the synoptic network should make observations to meet synoptic-scale requirements, whereas an aviation meteorological observing station should make observations that describe the conditions specific to the local site. Where stations are used for several purposes, for example, aviation, synoptic and climatological purposes, the most stringent requirement will dictate the precise location of an observing site and its associated sensors.
In addition to the physical location all principal climatological stations should be inspected no less than once every two years. Agricultural meteorological and special stations should be inspected at intervals sufficiently short to ensure the maintenance of a high standard of observations and the correct functioning of instruments.
References (12)
Bertrand D. Tanner, “Automated Weather Stations,” Remote Sensing Reviews 5, no. 1 (1990): 73-98.
“Weather Station Siting,” Campbell Scientific, Inc., accessed June 19, 2017, https://www.campbellsci.com/weather-station-siting.
On-Site Meteorological Program Guidance for Regulatory Modeling Applications, EPA-450/4-87-013 (Environmental Protection Agency, 1987).
Thomas C. Peterson, “Examination of potential biases in air temperature caused by poor station locations,” Bulletin of the American Meteorological Society 87, no. 8 (2006): 1073-1089.
Fiebrich, Christopher A., Kevin R. Brinson, Rezaul Mahmood, Stuart A. Foster, Megan Schargorodski, Nathan L. Edwards, Christopher A. Redmond, Jennie R. Atkins, Jeffrey A. Andresen, and Xiaomao Lin. "Towards the Standardization of Mesoscale Meteorological Networks." Journal of Atmospheric and Oceanic Technology (2020): 1-57. https://journals.ametsoc.org/view/journals/atot/37/11/JTECH-D-20-0078.1.xml?rskey=OVO0p0&result=1
Andrea J. Coop, Kenneth G. Hubbard, Martha D. Shulski, Jinsheng You, and David B. Marx, “Spatial accuracy of climate networks: a case study in Nebraska,” Journal of Applied Meteorology and Climatology 53, no. 8 (2014): 1932-1942. http://digitalcommons.unl.edu/cgi/viewcontent.cgi?article=1590&context=natrespapers.
"Guide to Instruments and Methods of Observation (WMO-No. 8)." World Meteorological Organisation: Geneva, Switzerland (2021). https://community.wmo.int/en/activity-areas/imop/wmo-no_8.
F. V. Brock, K. C. Crawford, R. L. Elliott, G. W. Cuperus, S. J. Stadler, H. L. Johnson, and M. D. Eilts, “The Oklahoma Mesonet: A Technical Overview,” Journal of Atmospheric and Oceanic Technology 12 (1995): 5-19. http://journals.ametsoc.org/doi/pdf/10.1175/1520-0426(1995)012%3C0005%3ATOMATO%3E2.0.CO%3B2.
J. Ehinger, “Siting and Exposure of Meteorological Instruments,” Instruments and Observing Methods Report No. 55, WMO/TD-No. 589 (Geneva, Switzerland: World Meteorological Organization, 1993).
“Air Quality,” United States Environmental Protection Agency, accessed June 19, 2017, https://www3.epa.gov/airquality/cleanair.html.
Matthew J. Menne, Claude N. Williams, and Michael A. Palecki, “On the reliability of the US surface temperature record,” Journal of Geophysical Research: Atmospheres 115, no. D11 (2010).
“AASC Instrumentation and Data Standards Committee Report,” The State Climatologist 9, no. 4 (October 1985): 12-14. http://www.stateclimate.org/sites/default/files/upload/pdf/state-climatologist/00000029.pdf.
Working with Landowners
The landowners that host your station sites are critical stakeholders and partners in your mesonet project. Building good relationships that benefit both the mesonet project and the individual landowners can help your project progress more smoothly. To maintain a good relationship, open, clear communication is essential. This includes using signed, written documents to establish the roles and responsibilities of landowners in relation to your mesonet project. For example, you may need a land lease agreement and a siting agreement.
When you are working with landowners, you will want to show them the value of hosting a site in terms of the benefit to the region, as well as the benefit they will receive. The following are some examples of possible benefits:
- A landowner that hosts a site typically acquires data that is directly relevant to his/her needs free of charge.
- Depending on the state’s tax laws, the landowner may receive a considerable subsidy for hosting a station.
- Farmers may be eligible for an incentive:
As mitigation incentive policies continue to be developed, farmers may potentially benefit from incentives that provide supplemental on-farm income in compensation for efforts to reduce emissions and sequester carbon.
Ideally, you and the landowners of your station sites will have a long, healthy relationship. No changes will be made to your site locations in terms of the land, and the landowners will remain the landowners and continue to care for the land. You will want to know of any future intended changes and how those changes may impact your stations. If possible, you want to continue collecting your data at all your original sites and not have to move any sites to nearby locations. Obviously, having long periods of continuous data for each site is the best-case scenario, but in an imperfect world, it might not be the reality you are faced with.
Unfortunately, certain practices that may be of little significance in an operational environment, such as relocating a station or shifting its observation time, may have a profound impact on the integrity of the historical record (Conrad and Pollak 1950).
The National Research Council (NRC 1999) recommended that the following ten climate monitoring principles, proposed by Thomas Karl et al. (NCDC, 1995), should be applied to climate monitoring systems:
- Management of Network Change: Assess how and the extent to which a proposed change could influence the existing and future climatology obtainable from the system, particularly with respect to climate variability and change. Changes in observing times will adversely affect time series. Without adequate transfer functions, spatial changes and spatially dependent changes will adversely affect the mapping of climatic elements.
- Parallel Testing: Operate the old system simultaneously with the replacement system over a sufficiently long time period to observe the behavior of the two systems over the full range of variation of the climate variable observed. This testing should allow the derivation of a transfer function to convert between climatic data taken before and after the change. When the observing system is of sufficient scope and importance, the results of parallel testing should be documented in peer-reviewed literature.
- Meta Data: Fully document each observing system and its operating procedures. This is particularly important immediately prior to and following any contemplated change. Relevant information includes: instruments, instrument sampling time, calibration, validation, station location, exposure, local environmental conditions, and other platform specifics that could influence the data history. The recording should be a mandatory part of the observing routine and should be archived with the original data. Algorithms used to process observations need proper documentation. Documentation of changes and improvements in the algorithms should be carried along with the data throughout the data archiving process.
- Data Quality and Continuity: Assess data quality and homogeneity as a part of routine operating procedures. This assessment should focus on the requirements for measuring climate variability and change, including routine evaluation of the long-term, high-resolution data capable of revealing and documenting important extreme weather events.
- Integrated Environmental Assessment: Anticipate the use of data in the development of environmental assessments, particularly those pertaining to climate variability and change, as a part of a climate observing system’s strategic plan. National climate assessments and international assessments (e.g., international ozone or IPCC) are critical to evaluating and maintaining overall consistency of climate data sets. A system’s participation in an integrated environmental monitoring program can also be quite beneficial for maintaining climate relevancy. Time series of data achieve value only with regular scientific analysis.
- Historical Significance: Maintain operation of observing systems that have provided homogeneous data sets over a period of many decades to a century or more. A list of protected sites within each major observing system should be developed, based on their prioritized contribution to documenting the long-term climate record.
- Complementary Data: Give the highest priority in the design and implementation of new sites or instrumentation within an observing system to data-poor regions, poorly observed variables, regions sensitive to change, and key measurements with inadequate temporal resolution. Data sets archived in non-electronic format should be converted for efficient electronic access.
- Climate Requirements: Give network designers, operators, and instrument engineers climate monitoring requirements at the outset of network design. Instruments must have adequate accuracy with biases sufficiently small to resolve climate variations and changes of primary interest. Modeling and theoretical studies must identify spatial and temporal resolution requirements.
- Continuity of Purpose: Maintain a stable, long-term commitment to these observations, and develop a clear transition plan from serving research needs to serving operational purposes.
- Data and Meta Data Access: Develop data management systems that facilitate access, use, and interpretation of data and data products by users. Freedom of access, low cost mechanisms that facilitate use (directories, catalogs, browse capabilities, availability of meta data on station histories, algorithm accessibility and documentation, etc.), and quality control should be an integral part of data management. International cooperation is critical for successful data management.
References (6)
National Research Council, Adequacy of Climate Observing Systems (Washington, DC: The National Academies Press, 1999). https://doi.org/10.17226/6424.
“Generating Local Weather Data,” How Montana’s Farmers and Ranchers can be at the Forefront of Addressing Climate Change, December 2016, 19. http://onemontana.org/sites/default/files/1Montana_Report_2016_final.pdf.
T. R. Karl, Vernon. E. Derr, David R. Easterling, Chris K. Folland, David J. Hofmann, Sydney Levitus, Neville Nicholls, David E. Parker, and Gregory W. Withee, “Critical issues for long-term climate monitoring,” Climatic Change 31, no. 2 (1995): 185-221.
Anthony Watts, “The 10 Climate Monitoring Principles,” Watts Up With That?, August 26, 2007, https://wattsupwiththat.com/2007/08/26/the-10-climate-monitoring-principles/.
Victor Anton Conrad and Leo Wenzel Pollak, Methods in Climatology, second edition (Cambridge: Harvard University Press, 1950).
Jerry Brotzge, “New York State Mesonet Aims to Improve Weather Monitoring for New York Farms,” Grassroots August 2015, 5.
Referencing and Documenting Your Sites
After you select the sites for your network of automated weather stations, you’ll need to describe them so that you can reference them accurately when asking landowners for permission to host sites, attaining building permits, etc. Hubbard and Siva Kumar offer this standard format for describing a site:
The site description might include aerial photographs, location plotted on a topographical map, photos corresponding to cardinal directions on the compass, descriptions of obstructions (height, distance, breadth), vegetation, and soil characterization. A site diagram would also be useful. Comments on land use surrounding the site or indications of and use from remote sensing data would also be useful.
(Photo courtesy of Dr. Jerald Brotzge, Program Manager, New York State Mesonet)
Hollinger and Scott offer this advice:
The station description should include an aerial photograph, a topography map of the area surrounding the station, and a map and description of the obstructions. Obstruction descriptions can be as simple as "a building is located within X meters and is Y meters tall and Z meters wide." Trees should be described as either evergreen needle or broadleaf, or deciduous. Shelterbelts or natural tree stands should also be identified and their density characterized.
Aerial photographs are valuable in that they provide a clear indication of the general vegetation and building clusters surrounding the station.
References (5)
"Guide to Instruments and Methods of Observation (WMO-No. 8)." World Meteorological Organisation: Geneva, Switzerland (2021). https://community.wmo.int/en/activity-areas/imop/wmo-no_8.
Kenneth G. Hubbard and M. V. K. Sivakumar, Automated Weather Stations for Applications in Agriculture and Water Resources Management: Current Use and Future Perspectives (proceedings of an international workshop, Lincoln, Nebraska, March 6-10, 2000). http://www.wamis.org/agm/pubs/agm3/WMO-TD1074.pdf.
Steven E. Hollinger and Robert W. Scott, “Station Wind Characterization,” Automated Weather Stations for Applications in Agriculture and Water Resources Management: Current Use and Future Perspectives (proceedings of an international workshop, Lincoln, Nebraska, March 6-10, 2000): 63-75. http://www.wamis.org/agm/pubs/agm3/WMO-TD1074.pdf.
Campbell Scientific, Inc., "Weather Station Siting and Installation Tools" application note (1997). https://s.campbellsci.com/documents/us/technical-papers/siting.pdf.
K. G. Hubbard and S. E. Hollinger, “Standard Meteorological Measurements,” Micrometeorology in Agricultural Systems 47 (2005). http://digitalcommons.unl.edu/cgi/viewcontent.cgi?article=1695&context=agronomyfacpub.
Working with Others
In addition to working with landowners to set your site locations for your mesonet, there are several organizations you will need to work with when designing your mesonet and trying to get your sites approved.
During their siting process, the New York State Mesonet worked with a wide variety of organizations. About half of their 126 standard sites are on private land; the remainder are on a mix of properties. During the siting process, they worked with the following:
- Federal agencies (for example, FEMA, FAA)
- State agencies (DHSES, DOT, DEC, Adirondack Park Agency, state prisons)
- City agencies (for example, CUNY schools, DEP)
- Numerous county and city planning boards
- Many K-12 schools and universities
References (1)
Jerald A. Brotzge, C. D. Thorncroft, E. L. Joseph, C. Appleby, N. Bain, N. Bassill, N. Farruggio, Z. Gao, K. Hemker, D. Johnston, E., Kane, S. McKim, P. Naple, S. Perez, J. Schwab, J. Sicker, J. Wang, B. Yin, and J. Yun, “The New York State Mesonet: A General Overview” (presentation at 97th American Meteorological Society Annual Meeting, Seattle, Washington, January 22-26, 2017). https://ams.confex.com/ams/97Annual/videogateway.cgi/id/38128?recordingid=38128&uniqueid=Paper313185&entry_password=205198.