Did you read our Southwest: Solving the Mystery of Erroneous Dam Monitoring Data case study? Want to get some more details? In this article, we’re going to take a closer look at that case study. If you haven’t read the case study yet, please do so!
Imagine stepping out of a routine sales meeting with a prospective client and being asked on the spot to back up what was discussed—either financially or through some action. This was the unexpected turn our lunch-and-learn took as we ventured into the world of explaining dam maintenance and sensor challenges.
While giving a presentation to company representatives* about our patented VSPECT™ technology, we shared a slide from a case study that showed very inconsistent data. One of the company’s employees stopped the presentation to say, “Hey, that’s what our data looks like!” The employees asked us what causes data to look like that, and we told them that electrical interference from a variety of sources can be introduced to the signal, which can foul the measurement.
We then explained that VSPECT can separate out the electrical noise frequencies from the signal and leave a clean, trusted measurement.
Of course, the employees wanted to see this in action!
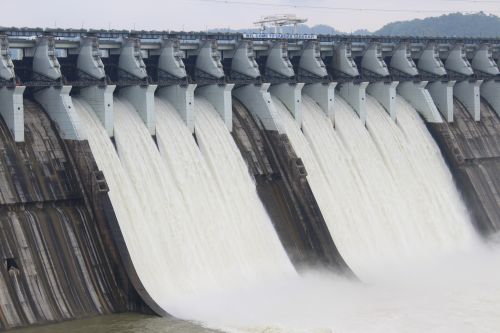
Company employees took us out to see several dams. At the first dam, the company sought to expand their reach by installing multiple CRVW3 Three-Channel Vibrating Wire Dataloggers in previously inaccessible areas. However, it was at our second stop that we were able to see their inconsistent data and show how our VSPECT technology works.
When we arrived at the second dam, the employees revealed that the power lines had recently been relocated 100 m (328 ft) closer to the sensors. Our Campbell Scientific team speculated that the power lines were causing unreliable data on the sensors, leading to erratic readings and confusion.
This sent us on a quest for answers…
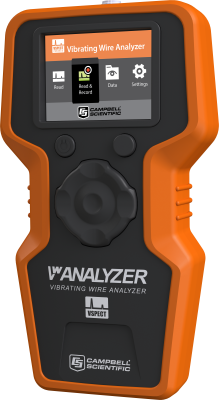
We were determined to uncover the truth, so we meticulously tested each sensor, comparing readings with precision using VWAnalyzers (vibrating wire field readers). We delved deeper into the complexities of frequency, noise, and amplitude, searching for clues to solve this mystery. We were able to confirm our earlier speculation as to the root cause: not faulty sensors, but disruptive electrical interference from those power lines.
In our testing, we used a typical vibrating wire readout box that showed inconsistent measurements. Then we used our VWAnalyzer to measure the sensors with VSPECT technology and see not only the frequency and temperature, but also the signal amplitude, decay ratio, and noise frequencies. We ended up testing every sensor at that station. For additional proof, the employees asked us to measure the same sensor with two different VWAnalyzers (one they had purchased previously and one that our application specialist brought with him). The results were within 0.1 Hz frequency and 10 µV amplitude of each other.
Our Campbell Scientific team spent a few hours comparing every single sensor at that dam, using two VWAnalyzers in continuous mode. We noticed the noise frequency was constantly changing and the signal-to-noise ratio was lower than is typical. This led us to diagnose electrical noise and corrupted data, caused by the relocation of the aforementioned power lines.
What happened next?
The company made the decision to invest in CR6 Automated Monitoring Platforms and multiplexers, a move that would revolutionize their approach to sensor maintenance. In the end, they saved more than $1 million they would have spent to replace their sensors.
Through reading the case study and this blog article, I hope you can see the value of not automatically replacing your sensors when your data is inconsistent. Rather, first ensure that the erratic data you’re receiving isn’t due to faulty readings. In this example, the relocation of the power lines resulted in unreliable data, and new sensors were not needed to acquire reliable data.
*Please note that due to confidentiality concerns, the client, location, and identifying information for this case study cannot be provided.
If you have any questions or comments, please post them below or reach out to our infrastructure team at CSI-Infrastructure@campbellsci.com.
Credits: Michael Adams of Campbell Scientific, Inc., contributed to this article.