This product is no longer available and has been replaced by: TGA200A.
| Services Available | |
|---|---|
| Repair | No |
| Calibration | No |
| Free Support | No |
Overview
The TGA100 was replaced with the TGA100A, which was replaced with the TGA200.
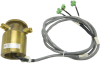
Upgrades are now available to operate a TGA100 analyzer with a thermoelectrically cooled (TEC) laser, enabling the analyzer to no longer require liquid nitrogen refills. Contact Campbell Scientific for more information.
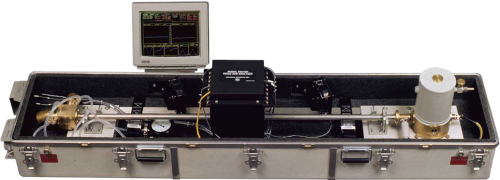
The TGA100 Trace-Gas Analyzer measures trace-gas concentration in an air sample using tunable diode laser absorption spectroscopy (TDLAS). This technique provides high sensitivity, speed, and selectivity. The TGA100 is a rugged, portable instrument designed for use in the field. It can measure one of a large number of gases by choosing appropriate lasers and detectors. It incorporates several features that make it ideal for measuring fluxes of trace gases using gradient or eddy-covariance techniques.
Images

Documents
Manuals
Case Studies
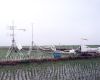
With instrumentation and help from Campbell Scientific, personnel from the Department of Atmospheric Sciences at......read more
Privacy Policy Update
We've updated our privacy policy. Learn More
Cookie Consent
Update your cookie preferences. Update Cookie Preferences